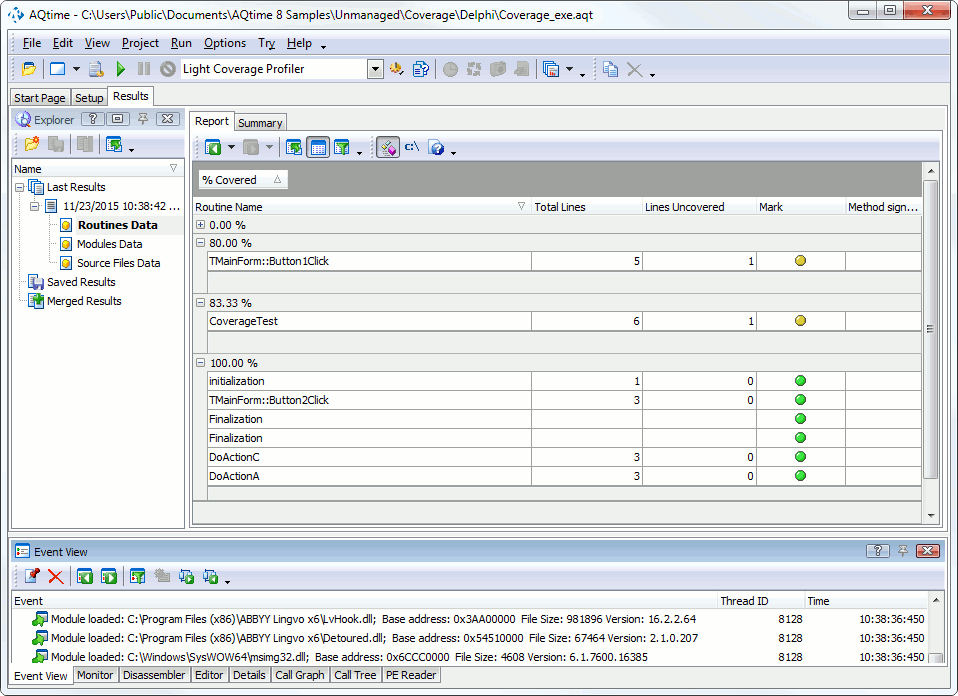
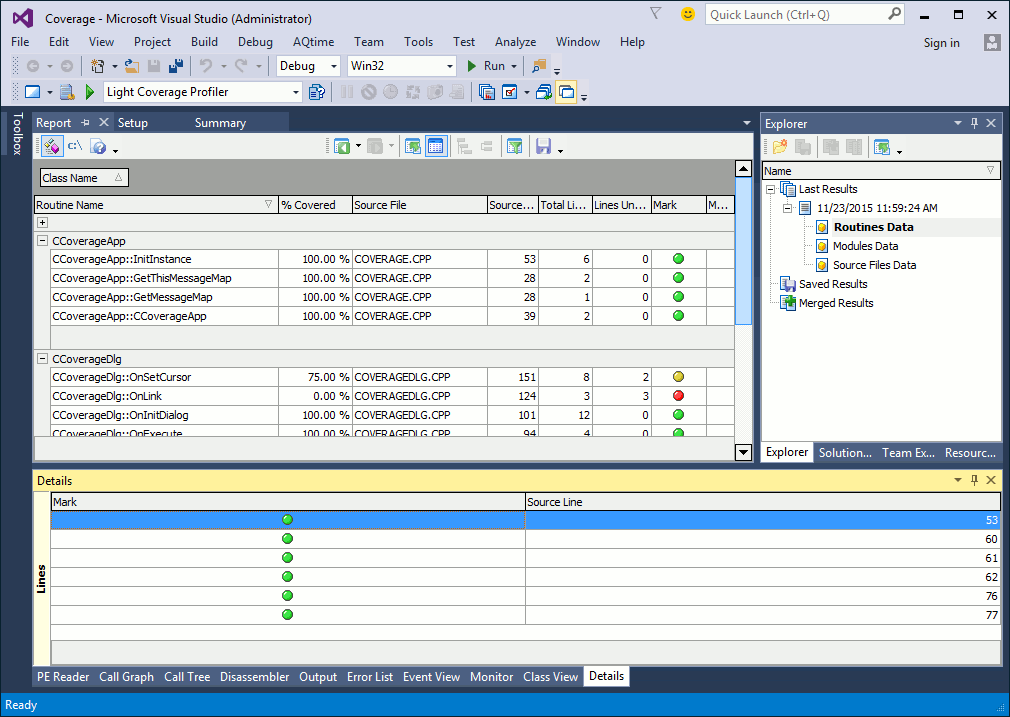
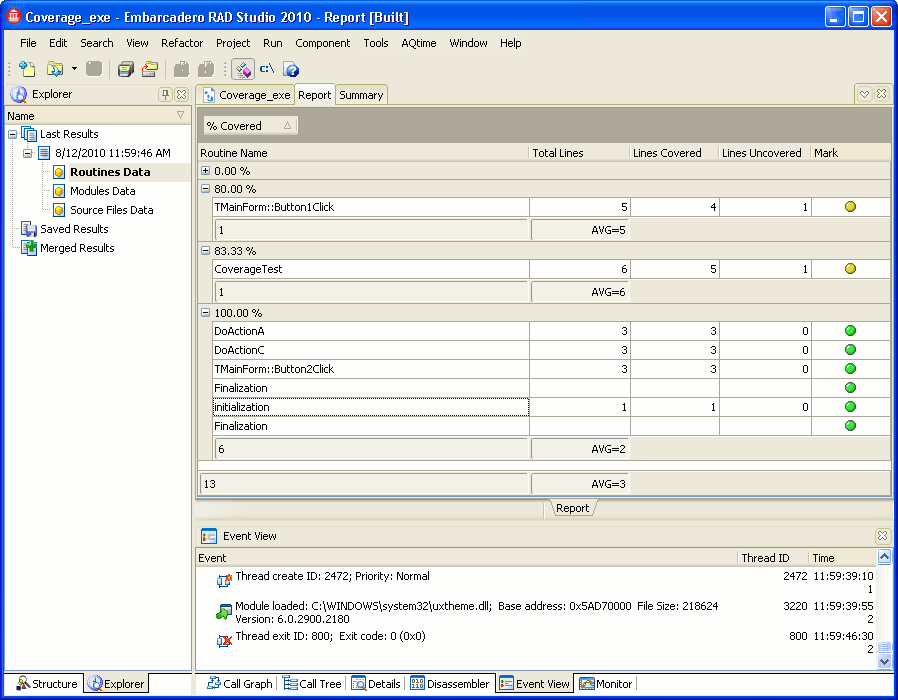
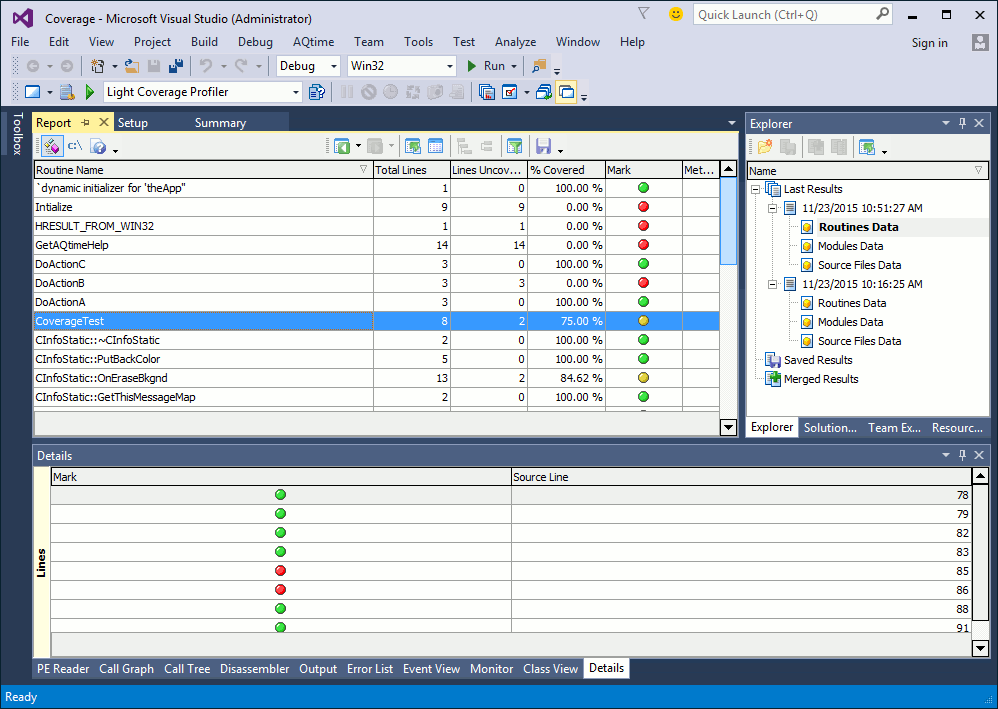
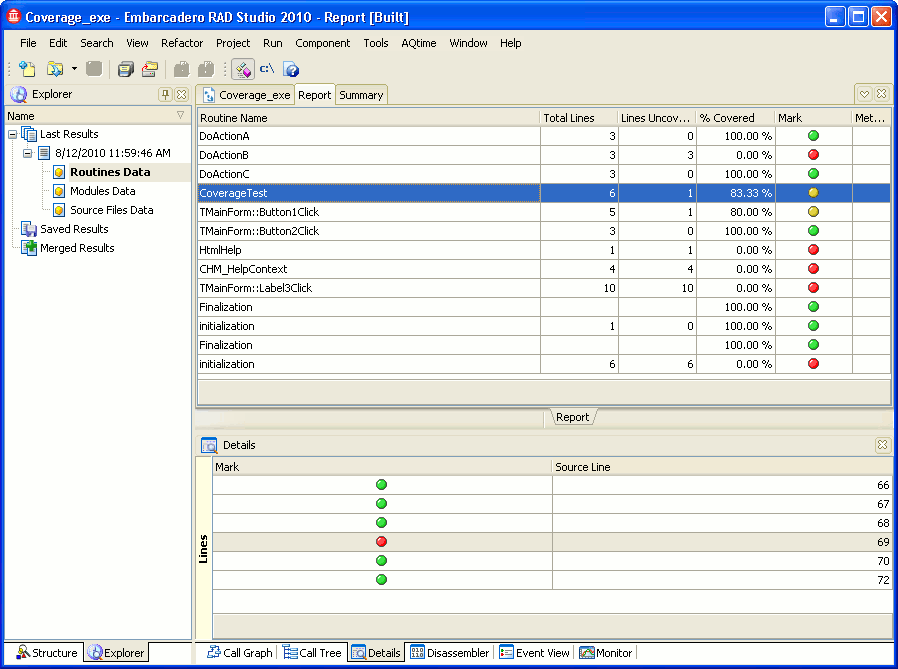
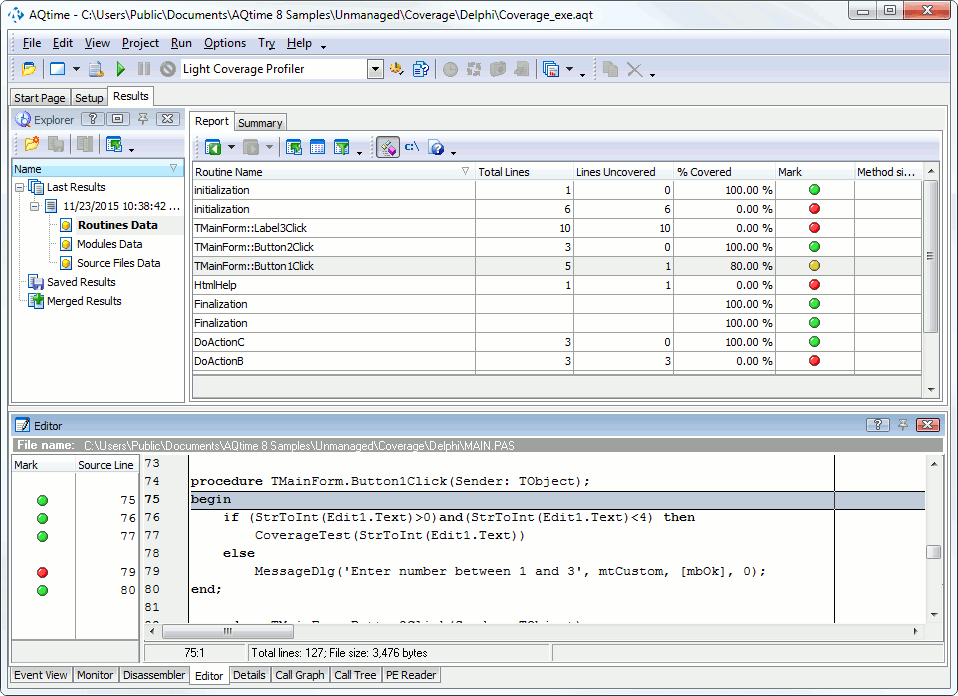
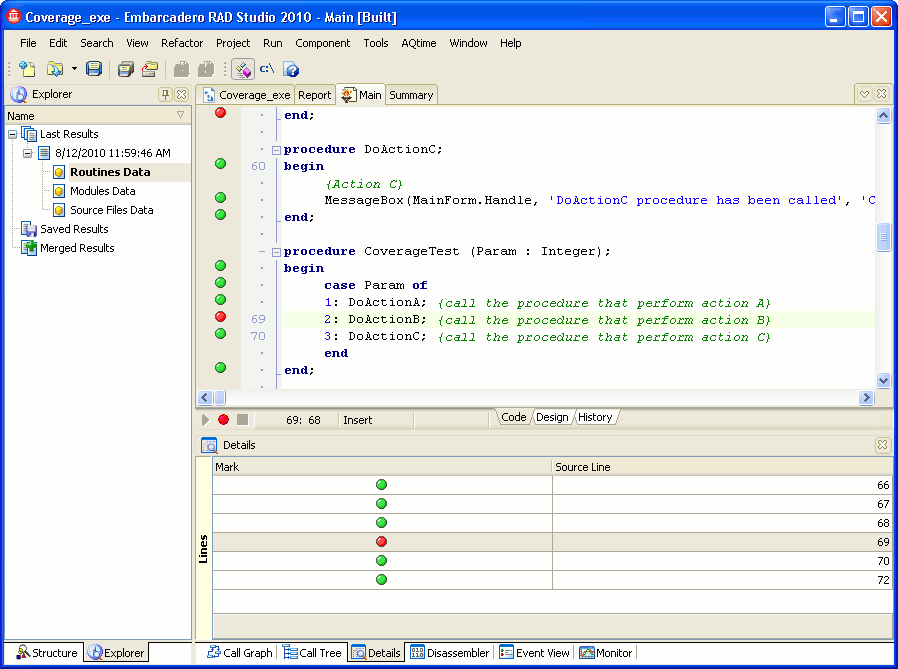
Light Coverage profiler results are divided into three categories: Routines Data, Modules Data and Source Files. When the Routines Data category is selected in the Explorer panel, each row in the Report panel corresponds to a single routine in your application. Selecting a routine in the Report panel will update the contents of the Details and Editor panels so they will display information concerning that routine.
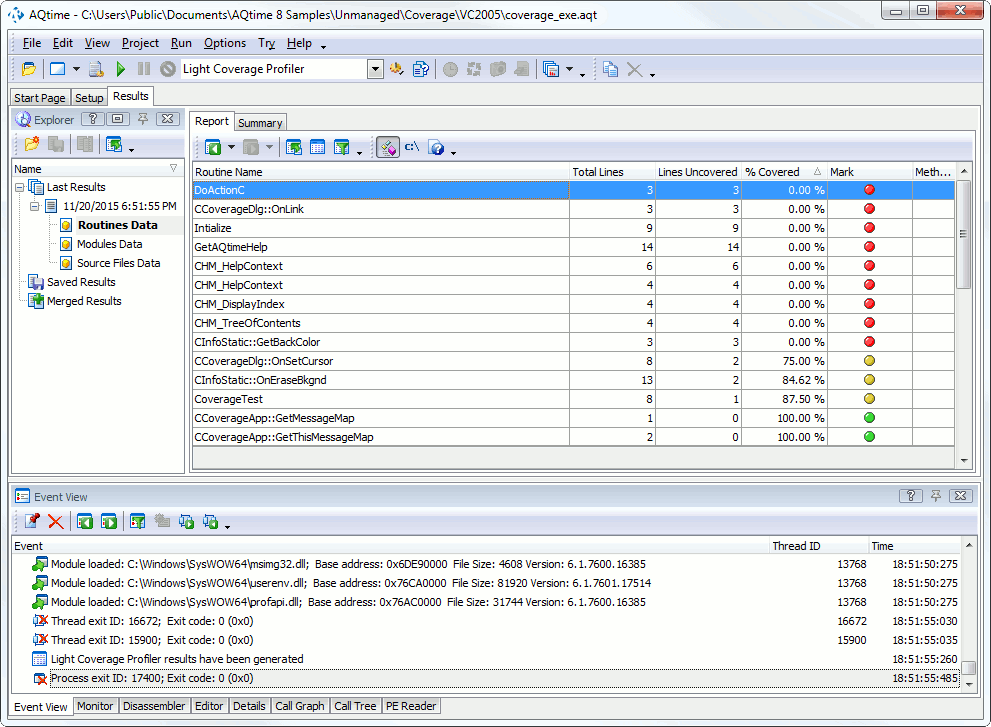
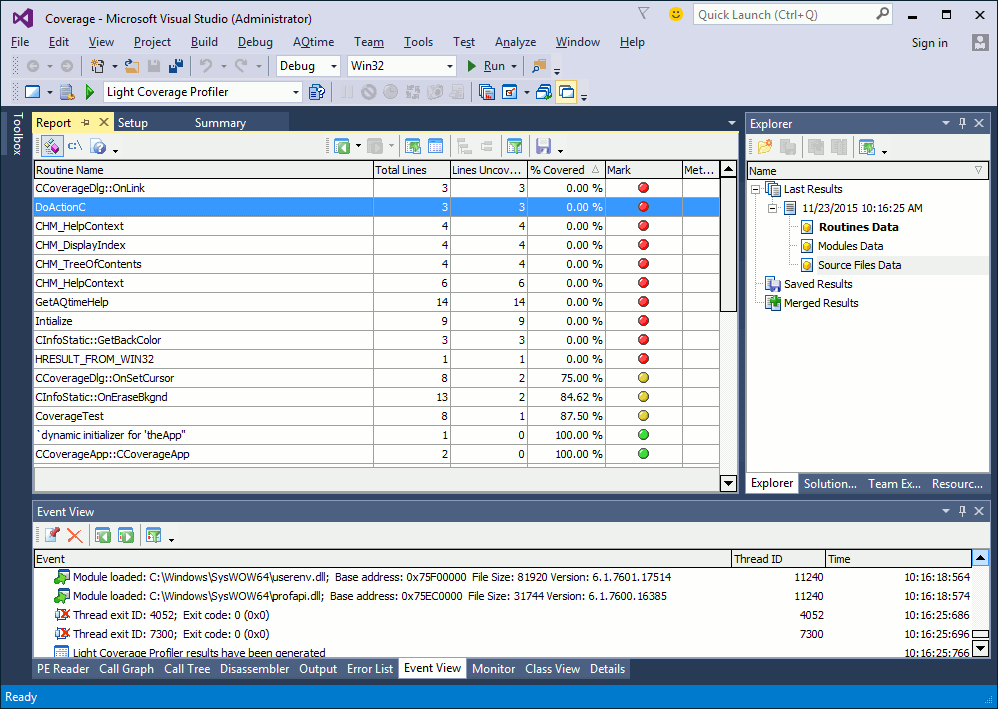
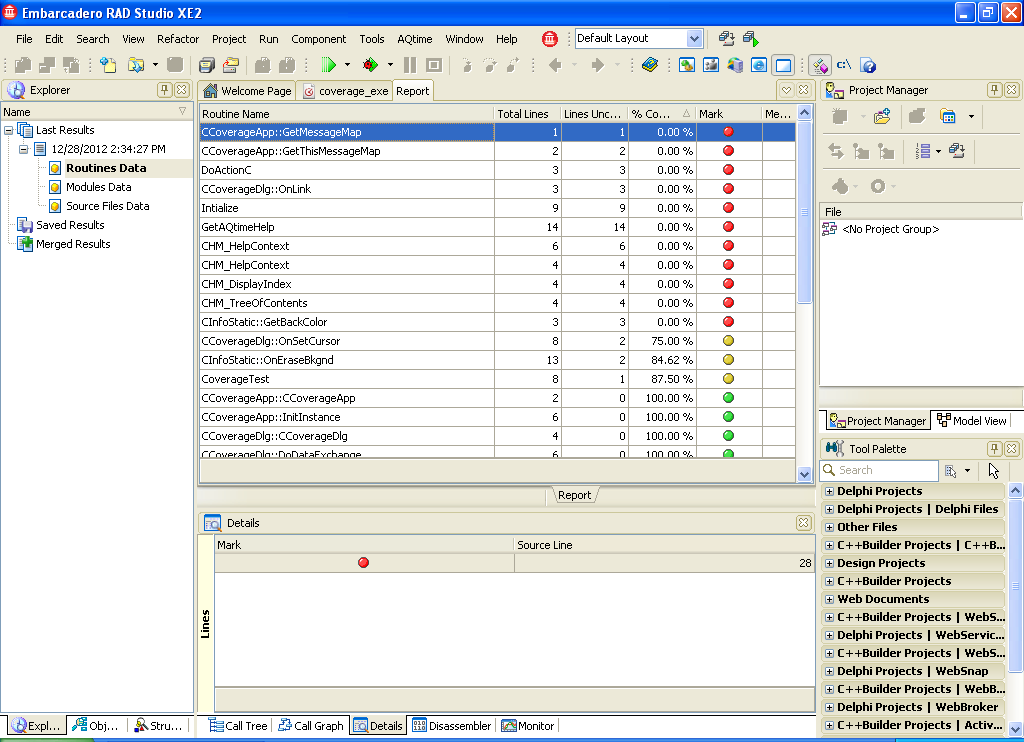
Below is sample output of Light Coverage profiler results displayed in the Routines Data category:
The following sections describe what information you can get from profiling results:
Viewing Profiling Results for Routines
After the profiling run is over, you can analyze the profiling results. The Report panel displays profiling results for all routines in your application. To analyze them quickly, you can sort out the profiling results by any column:
-
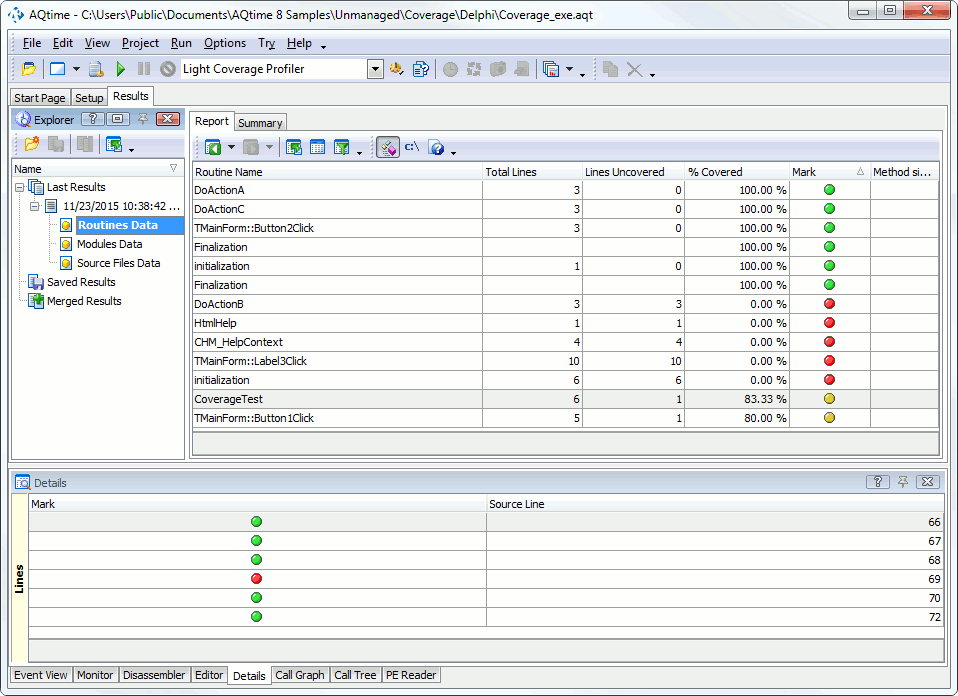
Sort out the results by the Mark column to see all routines that were executed during the profiling (marked with a green dot) and routines that were not executed (marked with a red dot).
-
Inspect the Lines Covered, Lines Uncovered, Total Lines and % Covered columns to identify untested code. For instance, if the function includes a large number of lines, most of which only a small percentage were executed during a seemingly “complete” test for the function, you might want to examine the function’s algorithm.
The summary values of the Lines Covered and % Covered columns display the total number of covered lines and the coverage percentage.
Note: AQTime gathers line coverage statistics for those routines that were added to line-level areas. If a routine was profiled at routine level, % Covered is either 100%, or 0%. If the Total Lines and the Lines Uncovered values are identical for a routine the routine was not called at all. -
To find the percent of covered lines in a class, unit or source file, group results in the Report panel by the Class Name, Unit Name or Source File columns. The group summary will display the coverage results for each class, unit or source file:
Tip: Use the Coverage profiling results to estimate whether your automated tests cover all the application areas and find untested or unnecessary code.
By default the Report panel shows only some of the available columns. You can customize them in any way you need: add more columns to the panel or remove the existing ones, move columns, change their width, etc. For more information on this, see Arranging Columns, Lines and Panels.
For the full list of available columns, refer to Light Coverage Profiler Panels Reference.
Viewing Profiling Results for Individual Code Lines
If you want to collect profiling results for code lines, the following requirements should be met:
- The application should be compiled with debug info (this concerns both unmanaged, .NET and Java modules). For more information, see How AQTime Profilers Use Metadata and Debug Information.
- The profiled routine should be added to a line-level profiling area. For more information, see About Profiling Levels.
If both conditions are met, you can view profiling results for individual source lines in the Details and Editor panel. Note, however, that profiling a large amount of code at line level can slow down the profiling process.
Details Panel
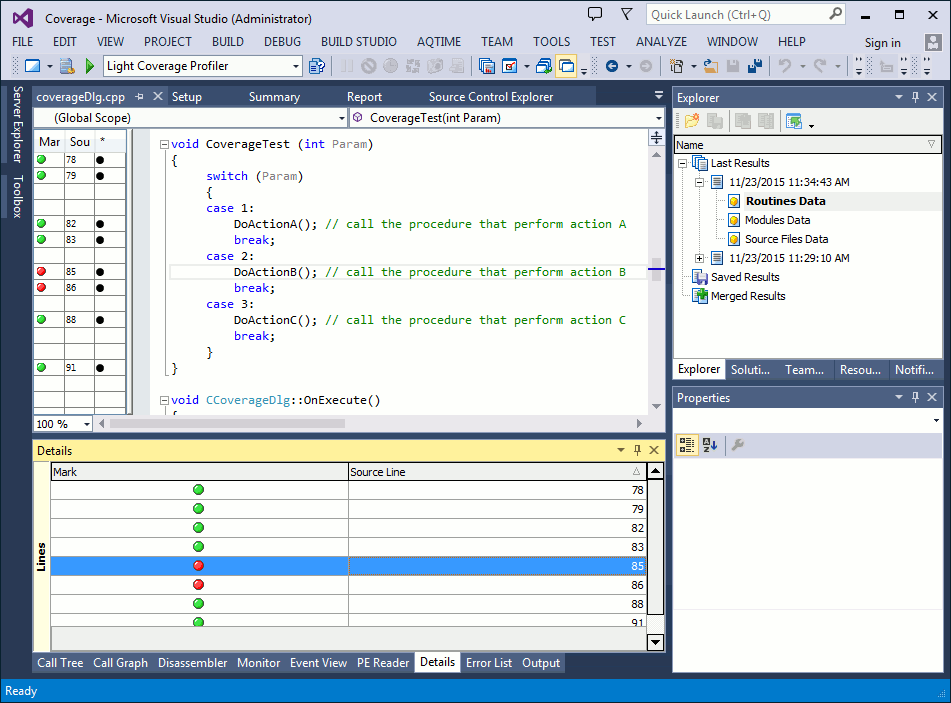
The Details panel contains line coverage profiling results. Here is a sample view of results in the Details panel:
Each row in this page corresponds to a source code line. If some routines were included in a line-level area and some were not, the panel will display only those lines that belong to the routines that were included. You can work with rows on the Lines page the same way you work with rows in the Report panel.
| Note: | Compilers can divide some source lines into several blocks. This typically occurs with if…then statements. If not all of the blocks were covered during the profiling, these lines are reported as partially executed. The Light Coverage profiler does not trace execution of these blocks. If at least one block was executed, the profiler treats the entire line as executed. To trace partially executed lines, use the Coverage profiler.
|
Editor Panel
Double-clicking a row in the Details grid will move the cursor in the Editor panel to the source code line for which that row displays results. If a routine was profiled at line level, the Editor’s grid will show the same results as the ones shown in the Details panel. For instance, you will find that the executed function and lines are marked with green dots and the unexecuted routines and line have red dots.
To select which columns to display in the gutter, use the Field Chooser window. To bring it up, select Field Chooser from the context menu. See Adding and Removing Columns.
 |
The Code Editor of Visual Studio lets you collapse and expand blocks of source code. The grid, which AQTime adds to the Code Editor to display profiling results, supports neither collapsing, nor expanding, because Visual Studio does not send appropriate notifications to AQTime. So, to ensure that the grid shows proper profiling results for source lines and routines, please expand all of the collapsed blocks of code. To do this, use the Outlining > Toggle All Outlining or Outlining > Stop Outlining item of the Code Editor’s context menu. |
 |
The Editor of Embarcadero RAD Studio lets you collapse and expand blocks of source code. The grid, which AQTime adds to the Editor to display profiling results, supports neither collapsing, nor expanding, because Embarcadero RAD Studio does not send appropriate notifications to AQTime. So, to ensure that the grid shows proper profiling results for source lines and routines, please expand all of the collapsed blocks of code. To do this, use the Unfold > All item of the Editor’s context menu. |
- Note that in order for AQTime to show source files in the Editor, the path to these files must be specified in the Project Search Directories or Search Directory dialogs. In addition, your applications must be compiled with debug information (see How AQTime Profilers Use Metadata and Debug Information).
- Information about lines depends on debug info attached to the executable. With the Light Coverage profiler especially, you should be on the lookout for unexpected discrepancies. Some compilers, for instance, such as Borland Delphi, will skip functions that are never called (this is called Smart Linking). Therefore, the debug information will log fewer functions and fewer lines than there are in the source file.
- The Editor can display incorrect profiling-related information for some C++ applications that use several functions based on the same template (see Profiling Template Functions). In this case, refer to the Report panel to get the correct results.
- Sometimes the Light Coverage profiler can report that the last line of your routine was not executed (it shows a red dot for this line in the Editor’s grid). The reason for this is that AQTime stops profiling a routine when the application executes the
retinstruction. Usually, this instruction is the last instruction in the routine’s binary code. However, compilers can produce code which includesretinstructions in “the middle” of a routine. For example, the following C++Builder code will insertretinstructions after eachcaseline of aswitch...caseblock.C++
void foo(int i)
{
. . .
switch(i)
{
case 1: //do something
break;
case 2: // do something
break;
}
} // This line is never executed -
Note once again that if at least one block of a partially executed line was executed, the profiler marks the entire line as executed. For more information, see above.
See Also
Light Coverage Profiler
Report Panel
Explorer Panel
Details Panel
Analyzing Profiler Results

 Viewing Profiling Results for Routines