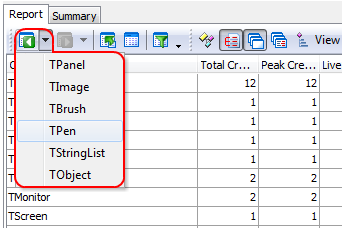
This topic describes how you can work with profiling results displayed in the Report panel:
Navigating Within the Results
Viewing a Summary for Individual Columns
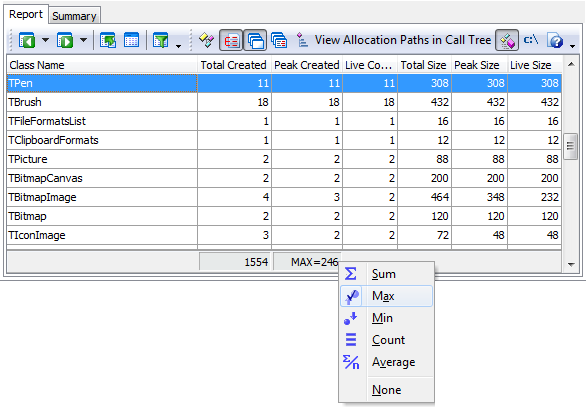
For each numerical column, the footer (the last grid row) can hold a summary field for all values in the column. The summary field can display the sum, average, maximum, minimum or count for the items displayed above it, or the summary can be disabled for the given column.

To change the format for the selected column's footer, right click on it and choose the desired format from the context menu. Note that the footer is hidden if the Show footer option is off.
Note that the Report panel's footer shows summary values for some panel columns. By default, the summary values are calculated against all panel rows. If you select two or more rows in the panel, AQTime will calculate the summary for the selected rows only.
If the records in the Report panel are grouped by one or several columns, and the Show group footer option is enabled, individual summary fields can be displayed for each group node.
Adding and Removing Columns
By default, AQTime does not display all the available columns in the Report panel (if it did the panel would be overloaded with results). You can add columns to and remove them from the panel at any time.
For more information on this, see Adding and Removing Columns.
Arranging Columns
You can arrange columns (move them, change their size, etc.) in the same way you do this in other AQTime panels. See Arranging Columns, Lines and Panels. Also, in the Report panel you can:
- Change a column's width so that the column becomes wide enough to display its contents and caption. To do this, select Adjust Column Width from the context menu or double-click the divider next to the right of the desired column.
- Change the font color for a column, its text alignment, its format string, etc., by selecting Format Columns from the context menu, which calls the Format Columns dialog.
- Change text alignment in a column by selecting Alignment from the column header's context menu. See Format Columns Dialog.
- Change the data display format for a column (Value, Percent, Graph Bar and Color) by selecting Display Format from the column header's context menu. See Displaying Results in the Report, Details and Disassembly Panels.
Simplifying Result Analysis
AQTime provides you with several features that simplify result analysis:
- Sort results by one or several columns. See Sorting Results.
- Find records (lines shown) by some key value, by using the Find dialog or the Incremental Search mechanism. See Searching Results.
- Filter results on-the-fly and create complex filter conditions. See Filtering Results.
- Apply pre-defined result views to instantly get a combination of filter and display settings.
- Group results into a subtree when they share one or several common key values by one or more Report columns.

 Navigating Within the Results

