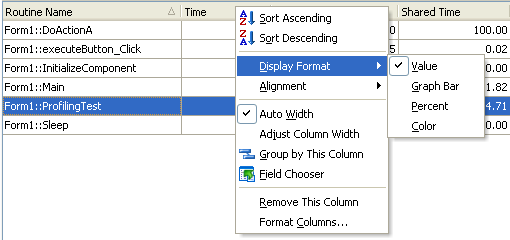
In the Report, Details and Disassembler panels each column holding results can display them in one of four ways, at your option: by percentage, by value, as a bar graph or as a colored mark. Bar graphs and colored marks are great for visual comparisons. They are formed on the basis of a percentage value: the length of the graph bar and the tint of the color mark graphically indicates the underlying value.
Display style is set by right-clicking on the header for the column and selecting Display Format from the context menu. Inapplicable display styles are disabled.

Another way to customize columns displaying results is to call the Format Columns dialog. Using this dialog you can easily tune the look, alignment, sorting and other properties of the panel’s columns. In the dialog the changes can be applied to all available columns, rather than only to the visible ones. This dialog can be called for every grid, not only for the Report, Details and Disassembler panels, and can be used to change the display format of those grids where the Display Format submenu is unavailable (for example, in the Editor’s grid or for the string columns.)
See Also
Changing Column Format
Report Panel
Details Panel
Disassembler Panel
