The Function Trace profiler monitors the execution flow of routines and gathers information on call stacks for each routine in your application. The following sections provide a brief overview of results and panels that hold them and explains how you can output profiling results to a file or the CodeSite tool:
Viewing Summary Profiling Results
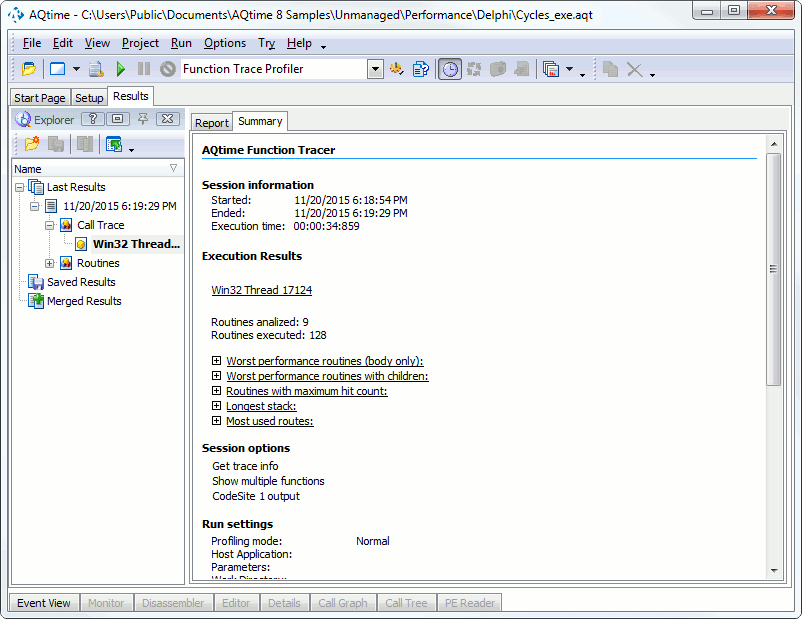
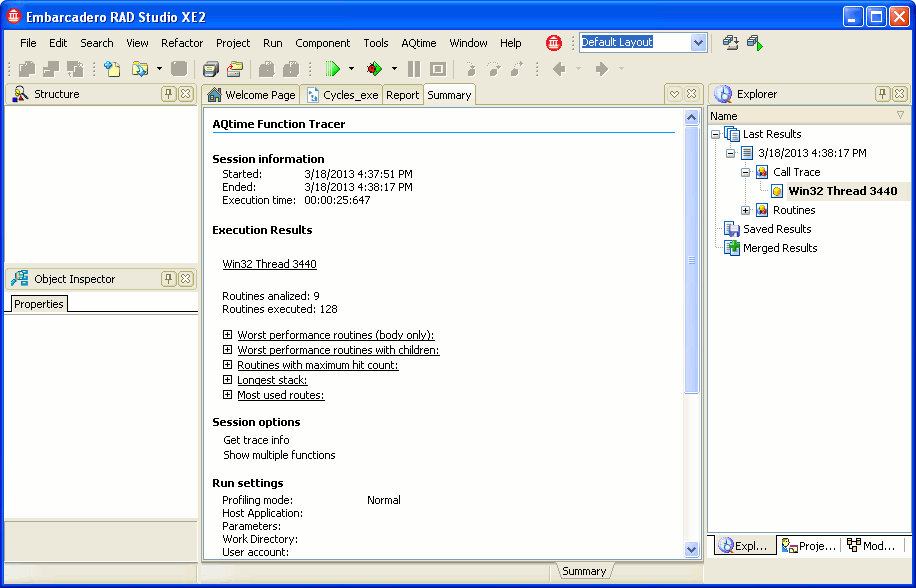
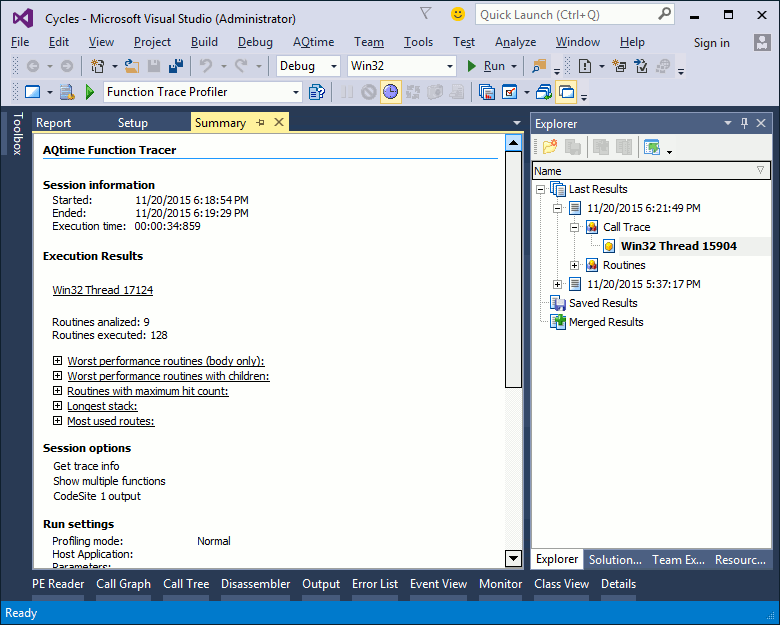
Brief results of the Function Trace profiler are displayed in the Summary panel. The panel shows worst performing routines, routines that are called in your application most than others, routines that have the longest call stack and so on:
Viewing Detailed Information
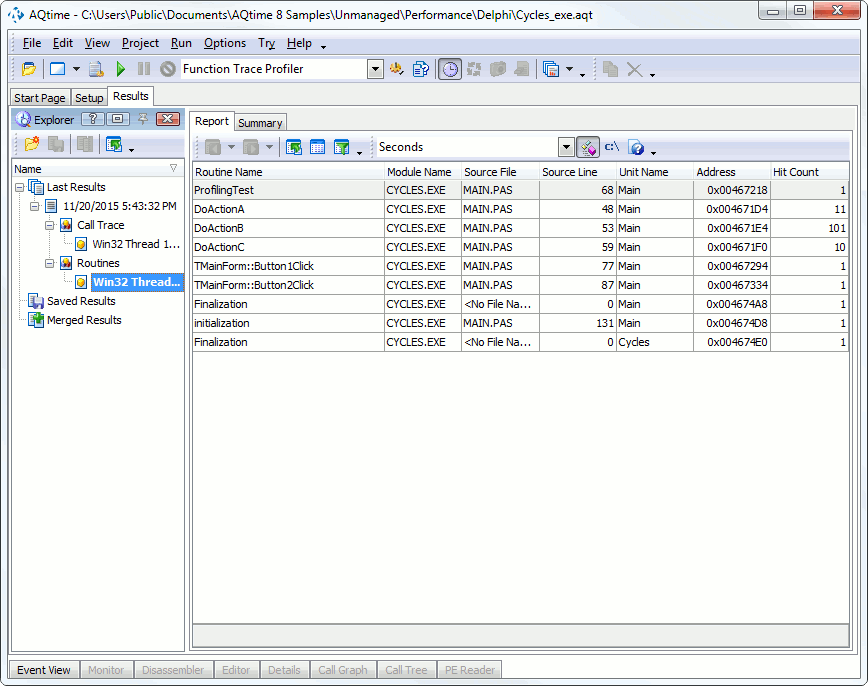
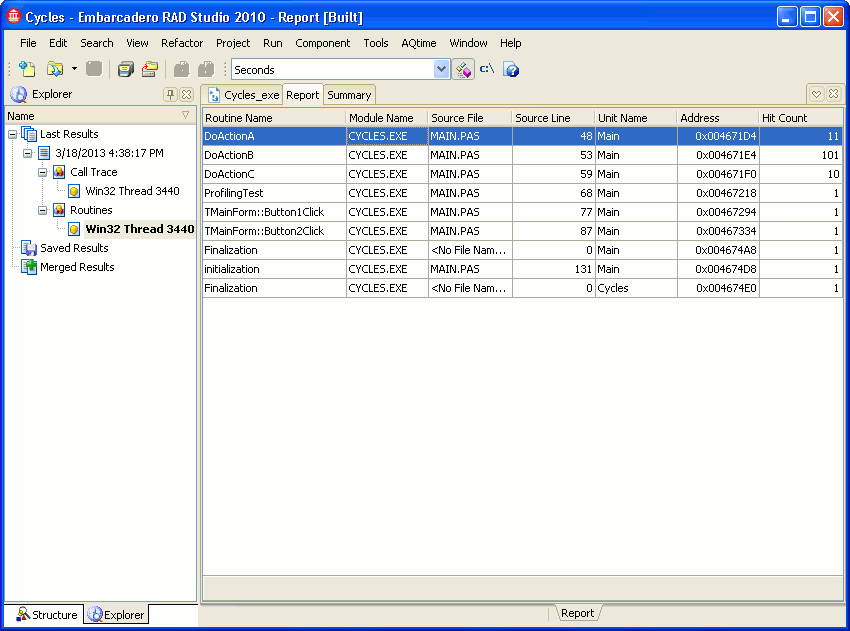
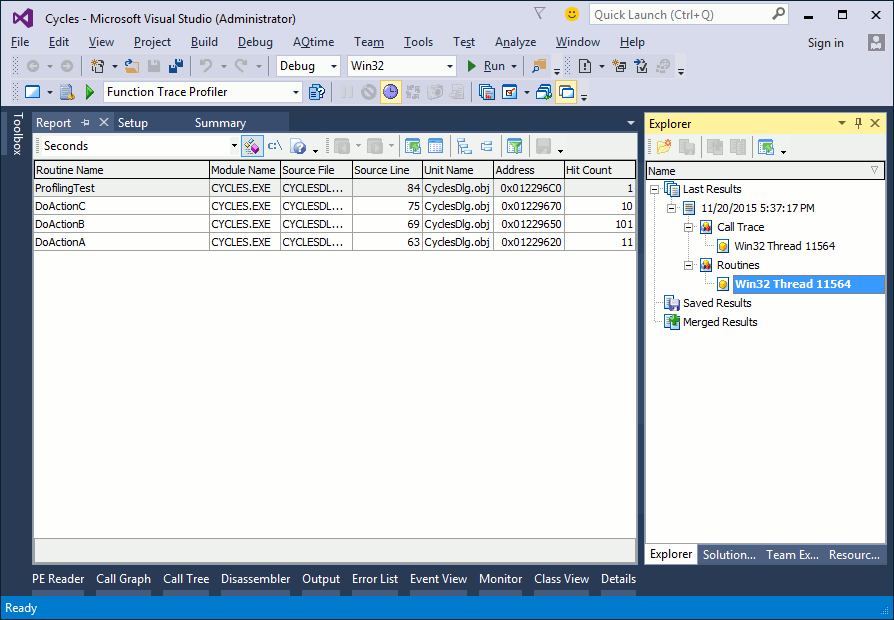
Information about routines used in your application is shown in the Report panel. Below is a sample output of the Function Trace profiler:
As you can see, profiling results are divided into two categories in the Explorer panel: Call Trace and Routines. The contents of the Report panel depend on which category is currently selected:
-
Call Trace
If selected, the Report panel shows the sequence of function calls for the selected thread. For a detailed description, see Results of the Call Trace Category.
-
Routines
If selected, the Report panel shows information about routines in the profiled modules. For a detailed description, see Results of the Routines Category.
Within categories in the Explorer panel profiler results are grouped by threads (Windows, CLR or COM). The thread model is specified by the profiler’s Thread Mode option.
When you select a routine in the Report panel, you can view additional information (for example, routine parameters or the sequence of calls that led to the routine call) in the Details, Call Graph and Call Tree panels. For a detailed description of the Function Trace profiler panels, see Function Trace Profiler Panels Reference.
Outputting the Function Trace Profiler Results
Besides generating results at the end of the profiling session or on demand (with the Get Results command), the Function Trace profiler can output real-time information into a text file or the CodeSite debugging tool. You can also create a custom DLL to specify how profiling results are to be processed and displayed.
Into Text Files
To output profiler results to one or several text files, enable the Text file output option. When the option is enabled, AQTime creates a text file for each thread from which profiled routines are called and writes the routine call order to those files. The name of each file matches the thread name or number.
AQTime posts two messages for each routine call, one on entry (marked with “->”) and one on exit (marked with “<-”). If the routine belongs to an area whose Retrieve parameter values property is enabled, the posted text also includes parameter names and values. Messages for child calls are placed between these two lines (if a lot of child calls occur, the two lines may be far apart).
The files are placed in subfolders that AQTime creates in the folder specified by the Text output directory option and these folders’s names correspond to the profiling date and time (the date is represented in the format specified by Windows Regional Settings, the time is represented in the hh:mm:ss format).
Into CodeSite Tool
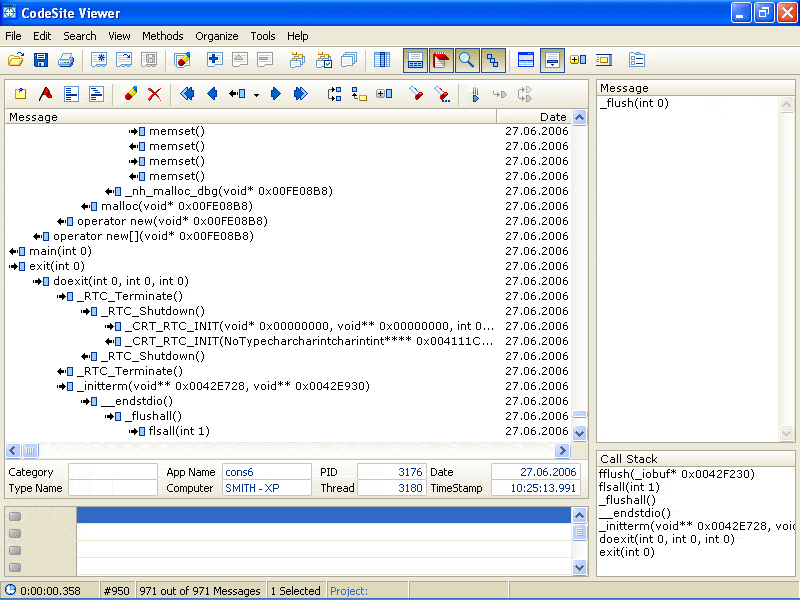
To output profiler results into the CodeSite debugging tool version 1, 2 or 3, enable the CodeSite 1 output or CodeSite 2/3 output option (depending on the CodeSite version you use). Note that the appropriate version of the CodeSite tool must be installed on your computer.
CodeSite is a product of Raize Software Inc. (www.raize.com), it is not supplied with AQTime.
If CodeSite is not running when you start the Function Trace profiler, the profiler will automatically launch it. If CodeSite is already running, Function Trace will use the running instance of the application to output results. The profiler does not close CodeSite when the profiling run is over, thus making it possible for you to analyze profiling results.
Using a Custom DLL
If you need special control over profiling results, you can create a custom dynamic link library that specifies how results are to be processed and displayed. To use your custom library to output results, enable the External DLL output option and specify the DLL name and path.
For more information on this, see Output the Sequence of Function Calls Using a Custom DLL.
See Also
Function Trace Profiler Results
Function Trace Profiler
Function Trace Profiler - Overview
Results of the Call Trace Category
Results of the Routines Category

 Viewing Summary Profiling Results