The Function Trace profiler results are divided into two categories: Routines and Call Trace. When the Routines category is selected, the Report panel lists all routines used by your application.
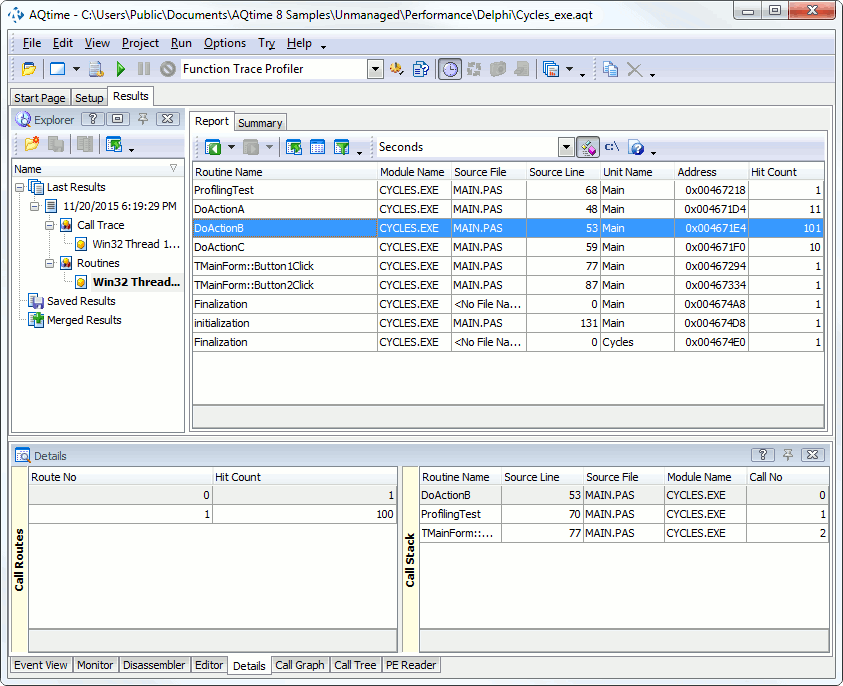
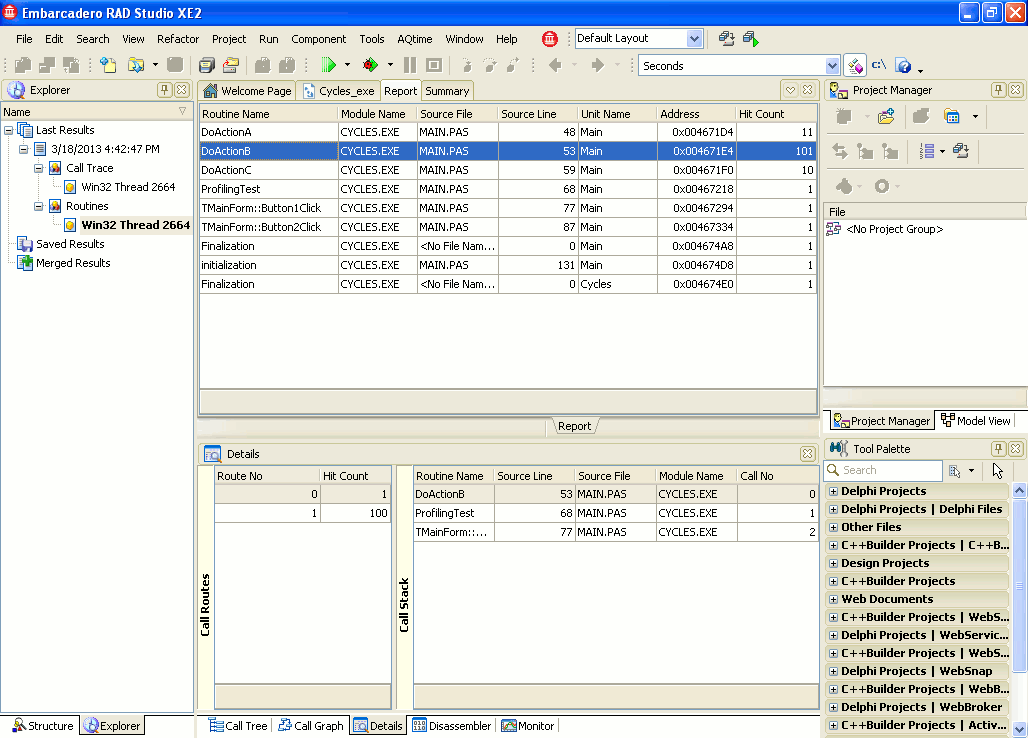
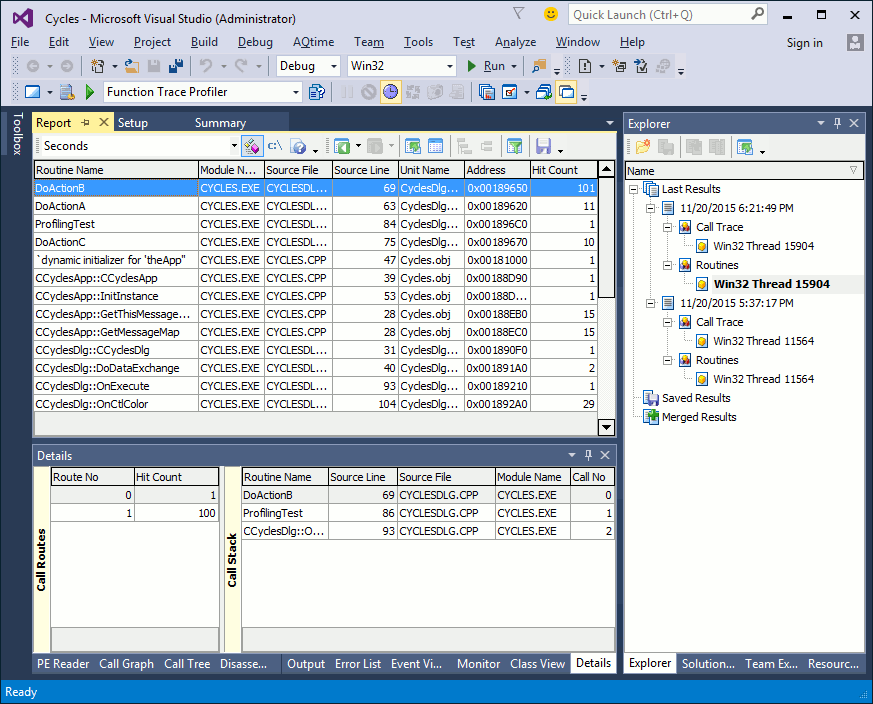
Here is a sample output of the Function Trace profiler results displayed in the Routines category:
This topic describes how to work with profiling results of the Routines category.
Viewing Profiling Results
Each row in the Report panel corresponds to a routine used by your application. Columns of the Report panel contain detailed information about each routine, for example --
-
The routines’ names are shown in the Routine Name column.
-
The Hit Count column displays how many times each routine was called.
By default, the Report panel shows only some of the available columns. You can customize them in any way you need: add more columns on the panel or remove existing ones, move columns, change their width, etc. For more information on this, see Arranging Columns, Lines and Panels.
For the full list of available columns, refer to Routines Category.
Editor Panel
If you double-click a routine in the Report panel, the cursor in the Editor panel will move to the source code line for the corresponding routine (the path to the source files must be specified in the Project Search Directories and Search Directory dialogs).If you double-click a routine in the Report panel, the cursor on the page that contains the application source code will move to the source code line for the compliance routine.If you double-click a routine in the Report panel, the cursor on the page that contains the application source code will move to the source code line for the compliance routine.
Viewing Call Routes and Call Stacks
With the Function Trace profiler you can find all routes used to call the selected routine. To view the call routes for a routine, select the routine in the Report panel and switch to Details. The Details panel includes two panes: Call Routes and Call Stack.
Call Routes Pane
Each call to a function has its call stack (or call route). The Call Routes pane holds a list of all call routes for the selected function.
The Route No column specifies the route number (AQTime enumerates routes in the order of their “appearance”), the Hit Count column specifies how many times the function was executed with this call route.
Call Stack Pane
The call route selected in the Call Routes pane is displayed in the Call Stack pane.
The first row in this pane displays the selected routine, the second row - the direct parent of the selected routine, the third row - the function that called the direct parent, and so on (see Routines Category).
| Note: | If the Maximum route depth option is 0 before the profiler starts, the profiler does not trace call routes, so the Details panel is empty. |
See Also
Function Trace Profiler Results
Function Trace Profiler Results - Overview
Results of the Call Trace Category


 Viewing Profiling Results