
The Function Trace profiler lets you trace routines called during the application runtime. This topic provides an overview of the Function Trace profiler.
 General Information
General Information
The Function Trace profiler provides you with comprehensive information about routine usage. It is a good way to find out how the routine can be called or to know the actual call stack for a function (for instance, a function that raises an exception). Also, you can use it when you need to know whether something occurs in the application at the expected point, for instance, whether the application posts data to the database right after a user has pressed OK. Another good use of the profiler is to profile an application with complex recursive calls.
The Function Trace profiler traces both 32- and 64-bit Windows and .NET applications and gathers information about each application function: different routes used to invoke the function, exact parameter values passed to the function, hierarchy of function calls, and so on. For a detailed description of information the profiler collects on function calls, see Function Trace Profiler Results - Overview.
The profiler generates results at the end of the profiling session when the profiled application is terminated or when you call the Get Results command. The profiler can also output real-time information into a text file, the CodeSite debugging tool or by using a custom dynamic link library. For information on how to do this, see the Outputting the Function Trace Profiler Results section of the Function Trace Profiler Results - Overview topic.
 |
The Function Trace profiler does not allow clearing the profiling results during the profiler run. |
The profiler collects information on function calls with the amount of details you specify in the profiler options. Note that collecting a large amount of data can significantly slow down your application during the profiling session. Use the Areas, Triggers and Ignore Files and Routines options to limit the amount of code the profiler analyzes. See Controlling What to Profile and Excluding Code From Profiling for more information.
Tracing Call Routes
It is obvious that a routine can be called by several different routines in your application. For instance, for routine B displayed on the figure below, there are two calling routes: C -> A -> B and E -> D -> A -> B.
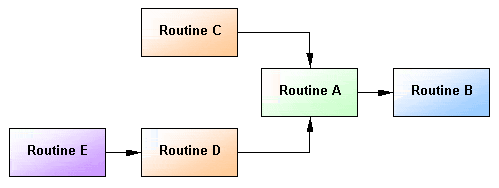
With the Function Trace profiler you can find all routes used to call the selected routine. Note that this is not the same as building the calls relationship (parents-children) graph. The calls relationships graph includes all “ancestors” of a routine without specifying the exact calling routes. For instance, in the Call Graph, generated for routine B, it would be rather difficult to find whether the route E -> D -> A -> B exists or if it is just a combination of two routes: D -> A -> B and E -> D.
Note that route tracing consumes a lot of memory and by default this functionality is turned off. To enable it, specify any value that is greater than 0 for the profiler’s Maximum route depth option. You can set this value in the Profiler Options dialog that is displayed every time you start profiling. If the option is 0, the profiler does not trace the routes.
Tracing Call Characteristics
By using the Function Trace profiler you can trace call characteristics (for example, the routine’s execution time) of routines in your applications. Which call characteristics to measure is defined by the Active counter option of the profiler. The following counters are available:
|
|
|
Some counters may be unavailable. For more information, see below. |
All counters work for managed and unmanaged code and support 32-bit and 64-bit applications. For a complete description of counters, see Counters Overview.
Important Notes
-
Results generated by the profiler depend on the counter used during the profiling run. For instance, if you profile your application with the Elapsed Time, User Time or User+Kernel Time counters, AQTime panels hold timing results.
-
Some counters may be unavailable. This depends on the CPU model and the software used. For instance, some counters do not work on Pentium II or do not support the processor’s SpeedStep technology, while others do not function under virtual machines. Also, if you run AQTime on a 64-bit operating system, some counters are available only if the OS is working in debug mode. For complete information on known counter restrictions, see Counters Overview.
-
Important: If you have Windows DDK installed, using some counters may cause the operating system to stop unexpectedly and display the error description on a blue screen. For more information on this problem and on how to solve it, see Counters Overview.
-
Important: If you use a computer that has several processors or a multiple-core processor (for example, dual-core CPU) and has Windows XP Service Pack 2, then you must install the Windows update #896256 in order for the profiler to be able to time your application correctly. The update is available on Microsoft’s web site:
See Also
Function Trace Profiler
Function Trace Profiler Options
Controlling What to Profile
Excluding Code From Profiling
Counters Overview