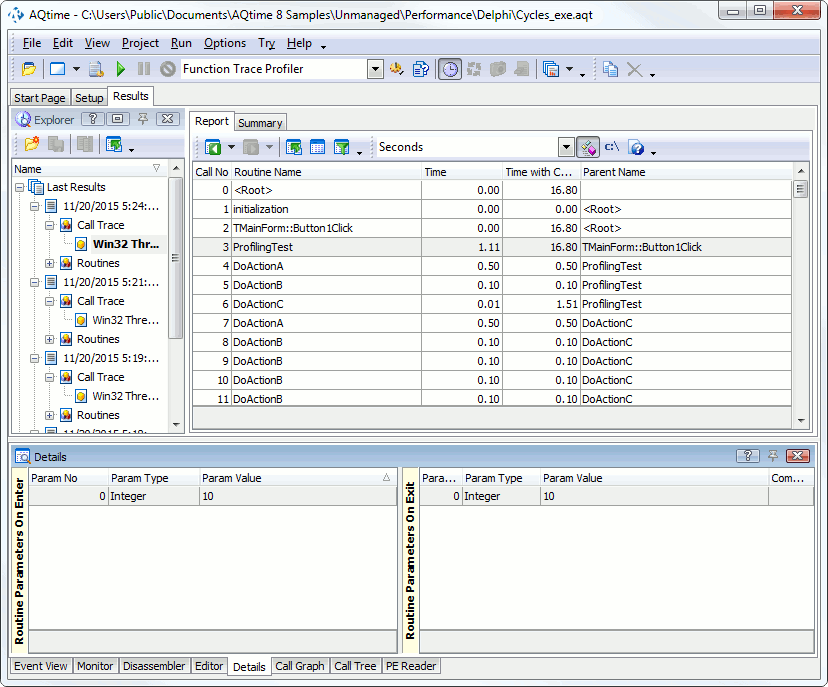
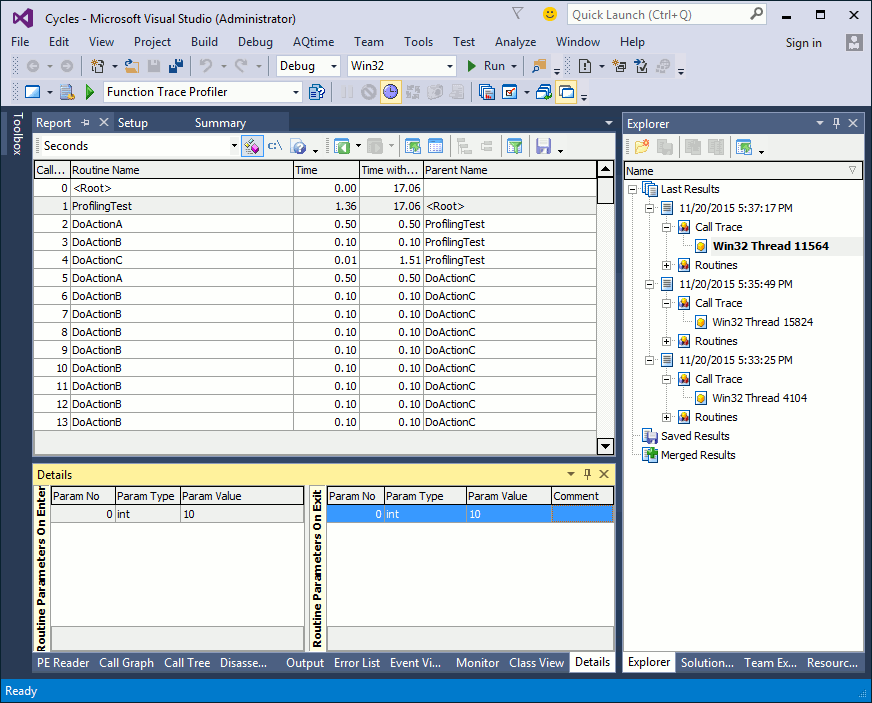
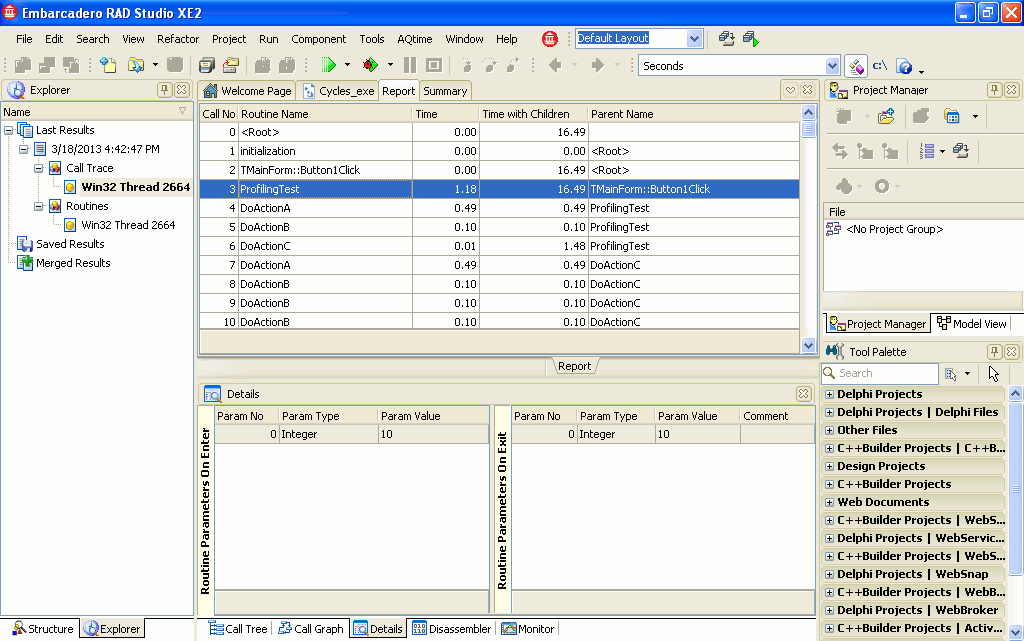
The Function Trace profiler results are divided into two categories: Routines and Call Trace. When the Call Trace category is selected, the Report panel displays the sequence of routine calls and call characteristics.
Here is a sample output of the Function Trace profiler results displayed in the Call Trace category:
This topic describes how to work with profiling results of the Call Trace category.
Viewing Profiling Results
The Report panel displays the sequence of routine calls that occurred in your application during the run and their call characteristics. Which call characteristics are to be measured is defined by the Active counter option of the profiler. For more information on available counters and characteristics they measure, see Counters Overview.
By default, the Report panel shows only some of the available columns. You can customize them in any way you need: add more columns on the panel or remove existing ones, move columns, change their width, etc. For more information on this, see Arranging Columns, Lines and Panels.
For the full list of available columns, refer to Call Trace Category.
Viewing the Call Hierarchy
The hierarchy of calls and some measured characteristics for the routine selected in the Report panel are displayed in the Call Graph and Call Tree panels.
Call Graph Panel
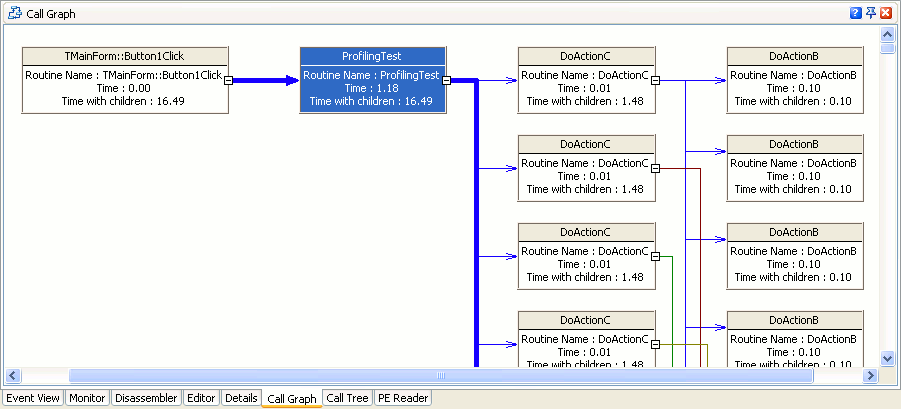
The Call Graph panel displays the call hierarchy for the routine currently selected in the Report panel:
Each called routine is represented by a rectangle. The upper part of the rectangle contains the routine name, the lower part - profiling results. The arrows show the sequence of routine calls.
Call Tree Panel
The Call Tree panel displays the call hierarchy for the routine currently selected in the Report panel. The panel has two tabbed pages: Children and Parents.
-
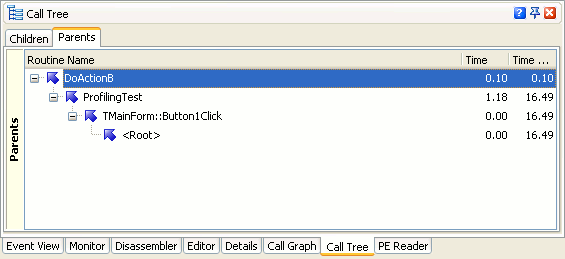
The Parents tabbed page displays a tree of calls that led to the selected routine call:
-
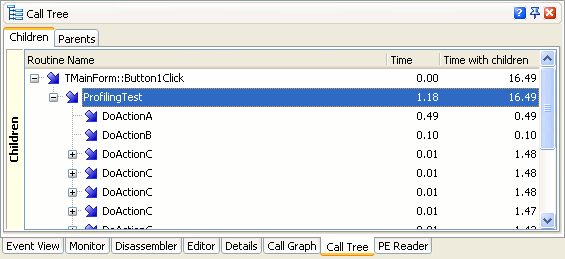
The Children tabbed page displays a tree of calls started by the selected routine:
For more information, see the description of the Call Graph and Call Tree panels.
Viewing Function Parameters and Result Values
The Function Trace profiler does not just log the sequence of function calls, but also logs parameters of function calls and function result values. To obtain information on a routine’s parameters and result values, make sure that the routine belongs to an including area whose Retrieve parameter values property is enabled.
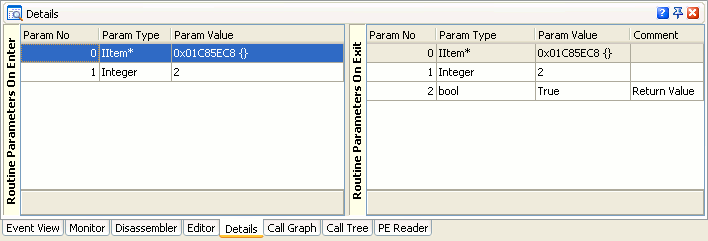
After the profiling is over, to view information on parameters and result values, select the desired routine in the Report panel. The Details panel contains two panes that display information on routine parameter values for entering and exiting the routine: Routine Parameters on Enter and Routine Parameters on Exit.
Routine Parameters on Enter Pane
The Routine Parameters on Enter pane shows parameters for entering the routine currently selected in the Report panel. The pane shows the parameter name, type and value.
Routine Parameters on Exit Pane
The Routine Parameters on Exit pane shows parameters for exiting the selected routine. The pane shows the parameter name, type and value. The function result value is marked in the Comment column of the pane.
For detailed information on routine parameters and result values displayed by profiling results, see Tracing Function Call Parameters and Result Values.
See Also
Function Trace Profiler Results
Function Trace Profiler Results - Overview
Results of the Routines Category
Tracing Function Call Parameters and Result Values

 Viewing Profiling Results