AppDynamics is an application performance monitoring solution for Java, .NET, PHP and Node.js applications. AlertSite integrates with AppDynamics to provide server-side transaction snapshots for your monitored web applications and APIs. The snapshots include diagnostic information like time spent in various backend areas, slowest methods and SQL queries, exception stack traces and more.
The integration means that AppDynamics collects snapshots for all transactions triggered by your AlertSite monitors. The monitor run results in AlertSite include links to these snapshots for better visibility into your application performance.
Requirements
-
AppDynamics Lite (free version) is not supported.
-
AppDynamics Agent must be installed and running on the application servers that run your monitored web applications or APIs.
-
If you use AppDynamics On-Premise (self-hosted), your Controller must be accessible from the Internet.
-
To configure AppDynamics integration, you must be an Admin, Co-Admin or Power User in AlertSite, and the administrator or account owner in AppDynamics.
-
If you use LDAP or SAML authentication in AppDynamics, you need to have a user in AppDynamics Settings > Administration > Users for integration with AlertSite (see below).
Supported Monitor Types
AppDynamics transaction tracing is supported for the following monitor types:
- website URL monitors,
- real-browser and mobile web monitors (DéjàClick) that use Firefox or Chrome,
- API endpoint monitors,
- SoapUI monitors.
Monitors that run on private locations (Private Node Server and InSite) are also supported.
Configure AppDynamics
Configure HTTP Request Data Collector
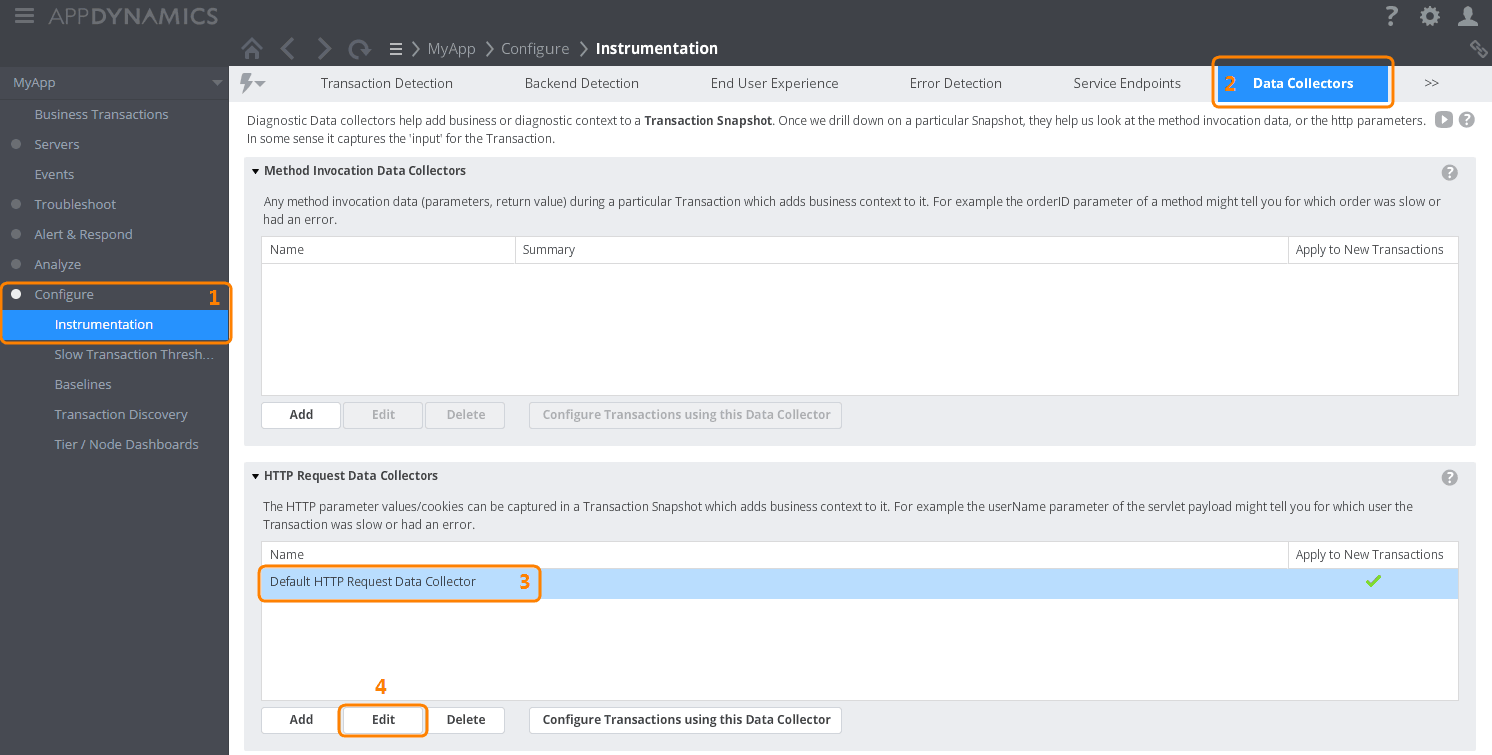
First, you need to configure AppDynamics data collector to capture transactions triggered by AlertSite monitors. For example, you can adjust the Default HTTP Request Data Collector that AppDynamics uses for all transactions.
-
Log in to AppDynamics Controller UI as an administrator or account owner.
-
On the Home screen, click the application you are monitoring with AlertSite.
-
On the left, select Configure > Instrumentation.
-
Switch to the Data Collectors tab. If you do not see it, click >> in the top menu and select Data Collectors.
-
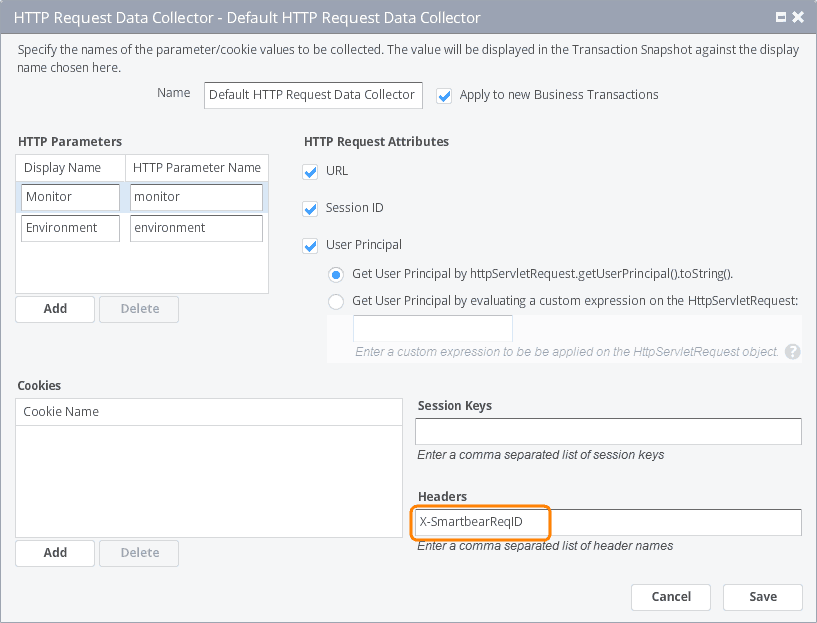
In the lower table, select Default HTTP Request Data Collector, and click Edit.
-
In the Headers text box, append X-SmartbearReqID at the end.
-
Click Save.
| Note: | It may take up to 1 hour for the changes to propagate to all AppDynamics Agents on your application servers. |
Create a Read-Only User (Optional)
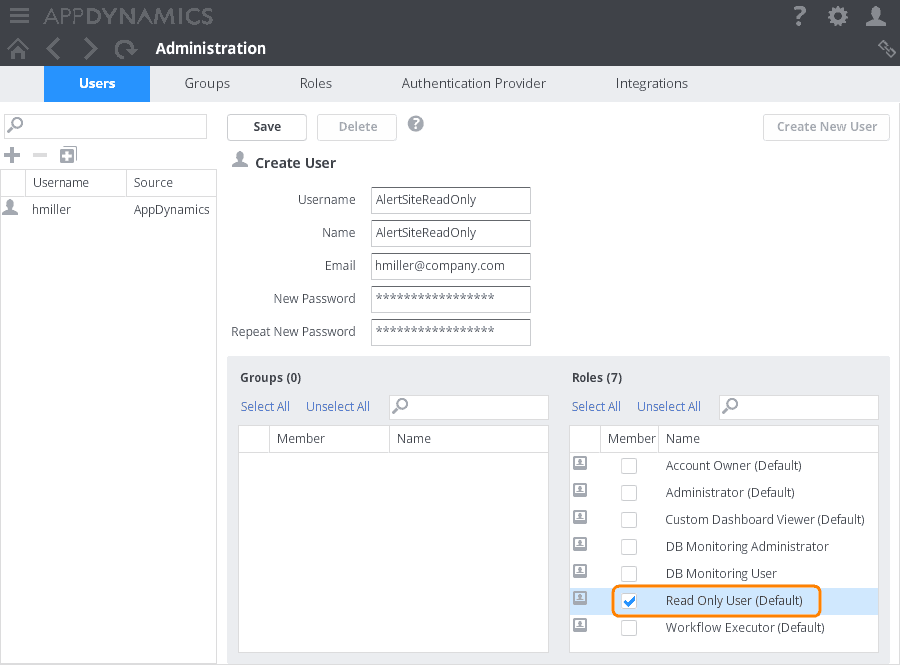
To connect to AppDynamics, AlertSite needs an AppDynamics username and password. AlertSite only needs read-only access to AppDynamics. So, you can use any user account, but for security purposes you may want to create a read-only AppDynamics user.
To create a read-only user:
-
From AppDynamics top menu, select > Administration.
-
Switch to the Users tab.
-
Click + above the user list.
-
Enter the Username, Name, Email and Password for the user.
The username must not include these characters:
& @ : \ / " [ ] | < > + = ; , ? * ' tab space
-
In the Roles table, select Read Only User (Default) and unselect other roles.
-
(Optional) In the Groups table, select a group for the user.
-
Click Save.
Configure AlertSite
-
Log in to AlertSite.
-
Select > Manage Integrations from the top menu.
-
Click AppDynamics.
-
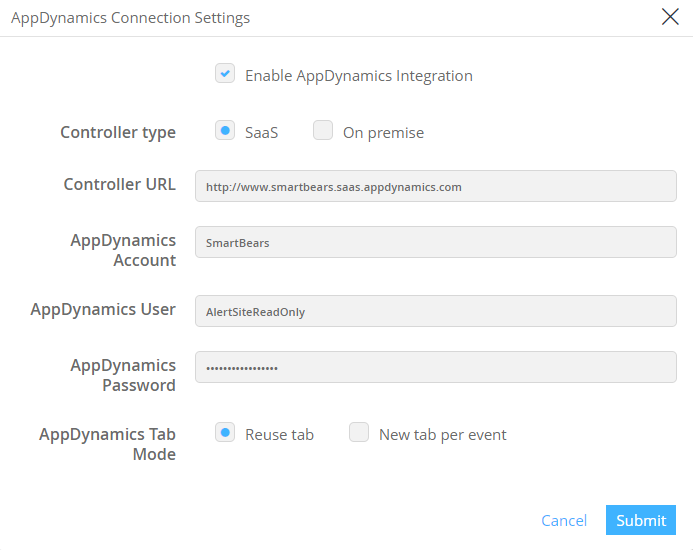
In the wizard, specify the AppDynamics connection settings:
Setting Description Type Your AppDynamics Controller type:
SaaS – hosted by AppDynamics.
On premise – hosted on your company-owned server.URL The URL you use to access AppDynamics Controller UI in a browser. Typical values:
SaaS:
http://<account>.saas.appdynamics.com/controller
On-Premise:
http://<controller-host>:<controller-port>/controller
Note: Use the https:// prefix if the Controller has SSL enabled.Account Only for SaaS Controllers. Your AppDynamics account name. User and Password The user name and password to connect to AppDynamics. This can be a read-only AppDynamics user you created for integration (see above).
Notes:
-
This account must be indicated in the Settings > Administration > Users section in AppDynamics. LDAP and SAML accounts are not supported. If you use LDAP or SAML authentication, create an AppDynamics user account for integration.
-
The username should not contain these characters: & @ : \ / " [ ] | < > + = ; , ? * ' tab space
AppDynamics Tab Mode AlertSite opens AppDynamics transaction snapshot in another browser tab. This option controls how many tabs to open:
Reuse tab – Open all snapshots in the same browser tab, so that a newly opened snapshot replaces the previously opened snapshot.
New tab per event – Open each snapshot in a separate browser tab.
-
-
Click Next.
-
Select the monitors where you want AppDynamics providing transaction screenshots.
Note: AppDynamics Agent must be installed and running on the application servers where these applications are hosted. -
Click Finish.
View AppDynamics Transaction Snapshots
When you are viewing results in the Monitor Runs dashboard in AlertSite, click the ![]() icon to open the AppDynamics transaction snapshot for the selected step.
icon to open the AppDynamics transaction snapshot for the selected step.
To access the snapshots:
-
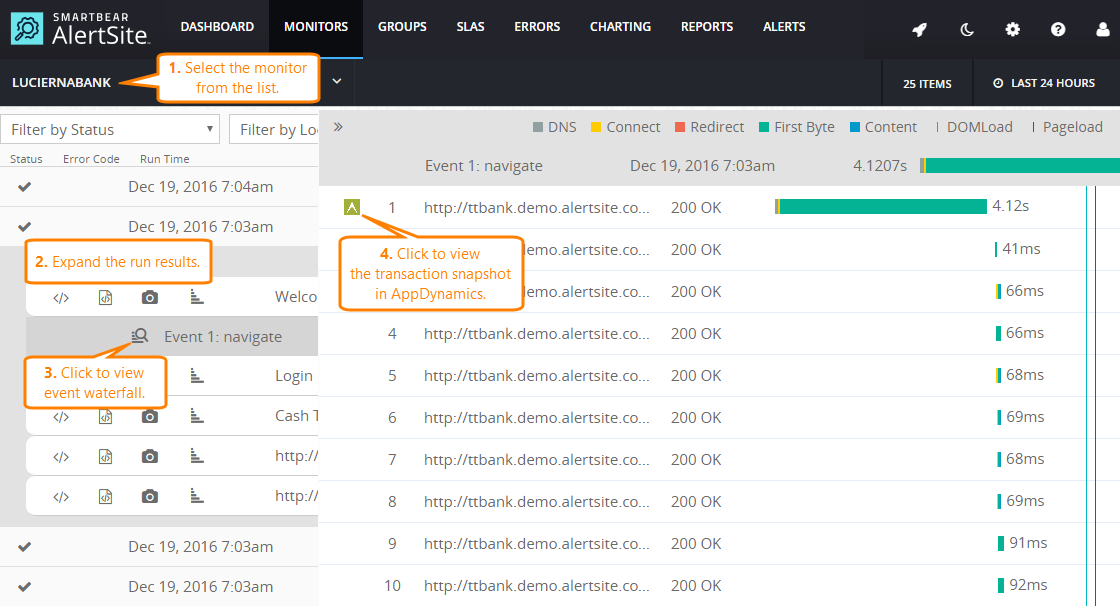
In AlertSite UXM, go to Monitors > Runs.
-
Select the monitor from the list at the top.
-
Expand a run. For DéjàClick and API monitors – expand it further down to a specific event or test step.
-
Click the + or
 Event Details button next to a step.
This opens the HTTP request waterfall chart for that step. Requests that have AppDynamics transaction snapshots are marked with the
 icon.
icon. -
Click
 to view the snapshot. It will open in a new browser tab.
Note: If you are not already logged in to AppDynamics, you will need to enter your AppDynamics username and password.
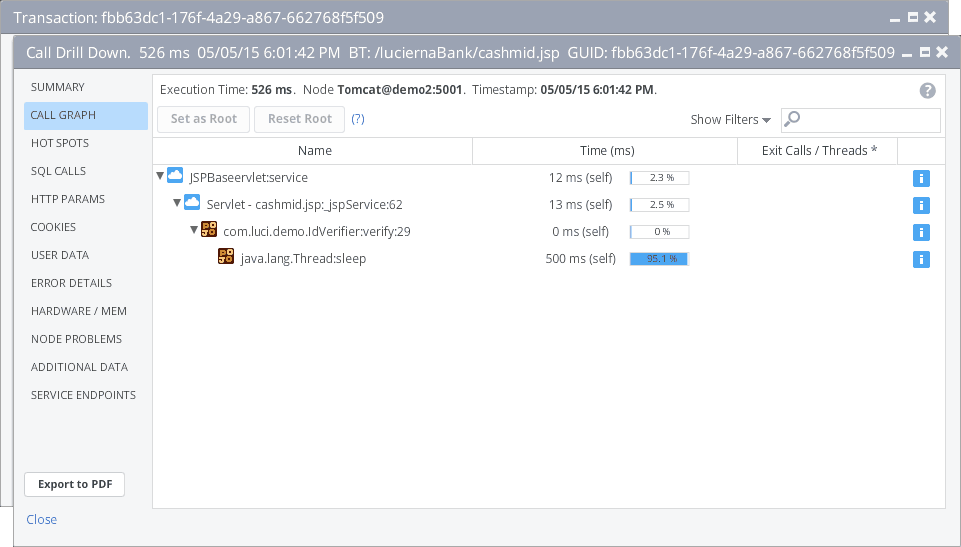
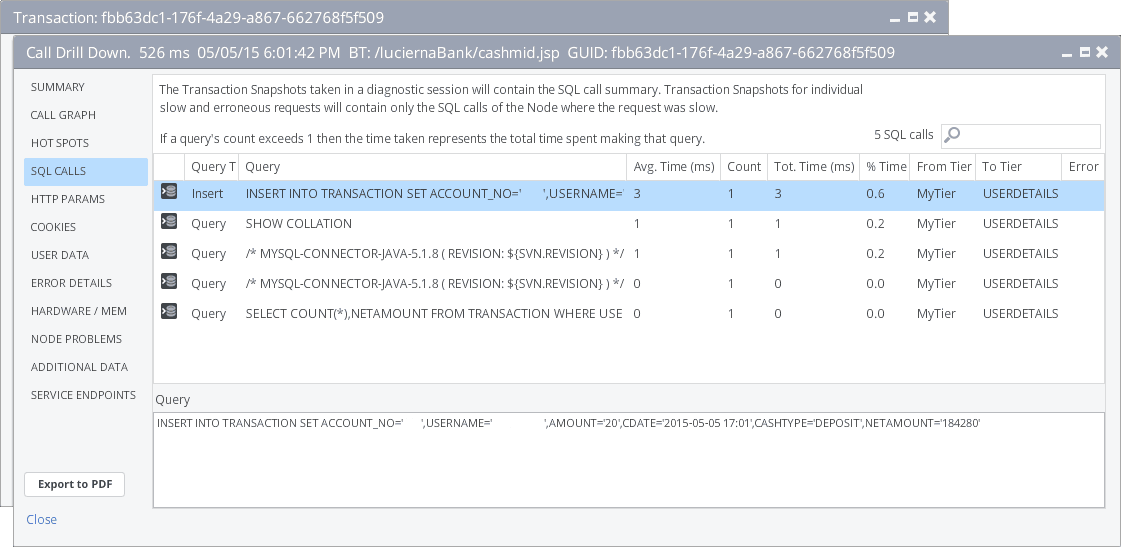
By default, the snapshot shows the Call Graph of all server-side method calls initiated by the transaction and the time spent on each method.
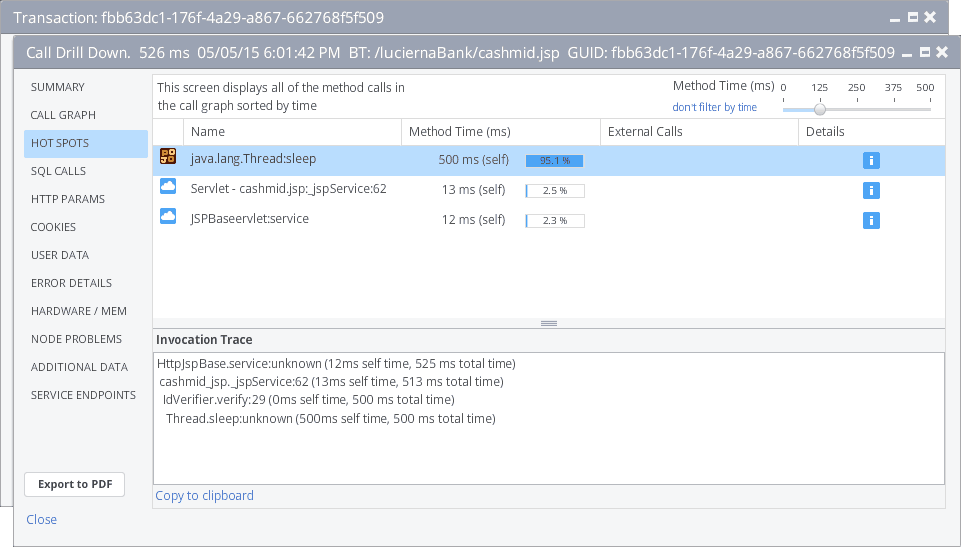
To view the slowest methods, switch to the Hot Spots section.
To view the most time-consuming SQL queries, switch to the SQL Calls section.
For more information about these snapshots, see Transaction Snapshots in AppDynamics documentation.
Enable or Disable AppDynamics Integration
Once the integration is set up, you can change the AlertSite monitors where you want to AppDynamics to collect transaction snapshots.
For one monitor
-
On the Dashboard, click on the monitor tile and select Edit Configurations.
–or–
Click Edit Monitor on the Monitor Summary, Monitor Availability, or Monitor Performance dashboard.
-
Click Advanced.
-
Select or clear the Enable Transaction Trace check box to enable or disable AppDynamics integration.
-
Click Submit.
For multiple monitors
-
Select > Manage Integrations from the top menu.
-
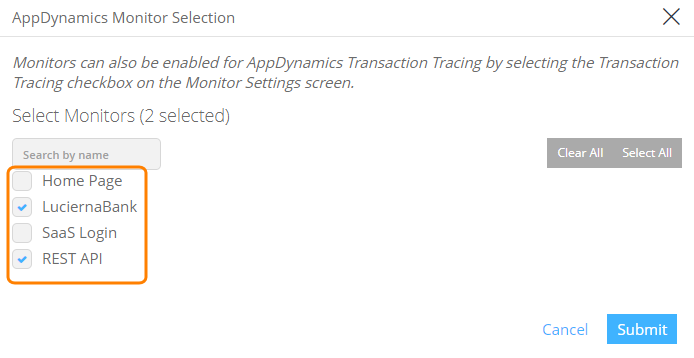
Click AppDynamics, then Select Monitors.
-
Select the check boxes next to the monitors.
Tip: Use the search box to find and filter monitors. -
Click Submit.
For all monitors
-
Select > Manage Integrations from the top menu.
-
Click AppDynamics, then Select Monitors.
-
Click Select All to include all monitors, or Clear All to exclude all monitors.
-
Click Submit.
Disable AppDynamics integration completely
-
Select > Manage Integrations from the top menu.
-
Click AppDynamics, then Connection Settings.
-
Unselect Enable AppDynamics Integration, and click Submit.
Frequently Asked Questions
Does AppDynamics integration consume measurement credits in AlertSite?
AppDynamics integration is free for all users of AlertSite and AppDynamics, and does not consume any measurement credits.
Can I see AppDynamics snapshots for monitor runs from before the integration?
No. Only runs that occurred after you configured the integration have links to AppDynamics snapshots, and only for those monitors that you selected for AppDynamics transaction tracing.
Does AppDynamics collect snapshots for monitors that are not selected for transaction tracing?
Yes and no. By default, AppDynamics captures snapshots only for slow and failed transactions – whether real user transactions or transactions triggered by AlertSite monitors. You can see these default snapshots on the Transaction Snapshots Snapshots tab of your application dashboard in AppDynamics. You cannot view them from AlertSite though.
Troubleshooting
If you have just configured the integration, wait for at least 1 hour to start seeing AppDynamics snapshot links in the monitor run results. Note that only runs, which occurred after the integration starts working, have snapshot links.
If your monitor run results do not include links to AppDynamics snapshots:
-
Make sure the monitor has transaction tracing enabled (either in the monitor settings, or in > Manage Integrations > AppDynamics > Monitor Selection).
-
Review the data collector configuration in AppDynamics, in the Configure > Instrumentation > Data Collectors section for your application:
-
Click Configure Transactions using this Data Collector, and make sure the desired transactions use this collector. Alternatively, edit the data collector and select the Apply to new Business Transactions check box to enable automatic transaction discovery.
-
Make sure the data collector settings include the X-SmartbearReqID header.
-
-
Make sure AppDynamics Agent is running on your application server. You can check the agent status in the App Servers list in AppDynamics.
You can also check if a snapshot exists in AppDynamics:
-
In AlertSite’s Monitor Runs dashboard, expand latest run results and note the request URLs and timestamps.
-
In AppDynamics:
-
Open the Business Transactions dashboard for your application.
-
Select a transaction ran by your monitor and click View Dashboard, then Transaction Snapshots.
-
See if there is a snapshot with the timestamp that matches the monitor run.
Note: You may need to select a longer time range for the dashboard. -
If there is no matching snapshot, double-check the data collector configuration.
-
If a snapshot exists:
-
Select it and click View Transaction Snapshot, then Drill Down.
-
Switch to the HTTP Params tab. It should show the Header-X-SmartbearReqID header.
-
If the header is not there, double-check the data collector configuration.
-
-
If these tips do not help resolve your issue, contact SmartBear Support.

