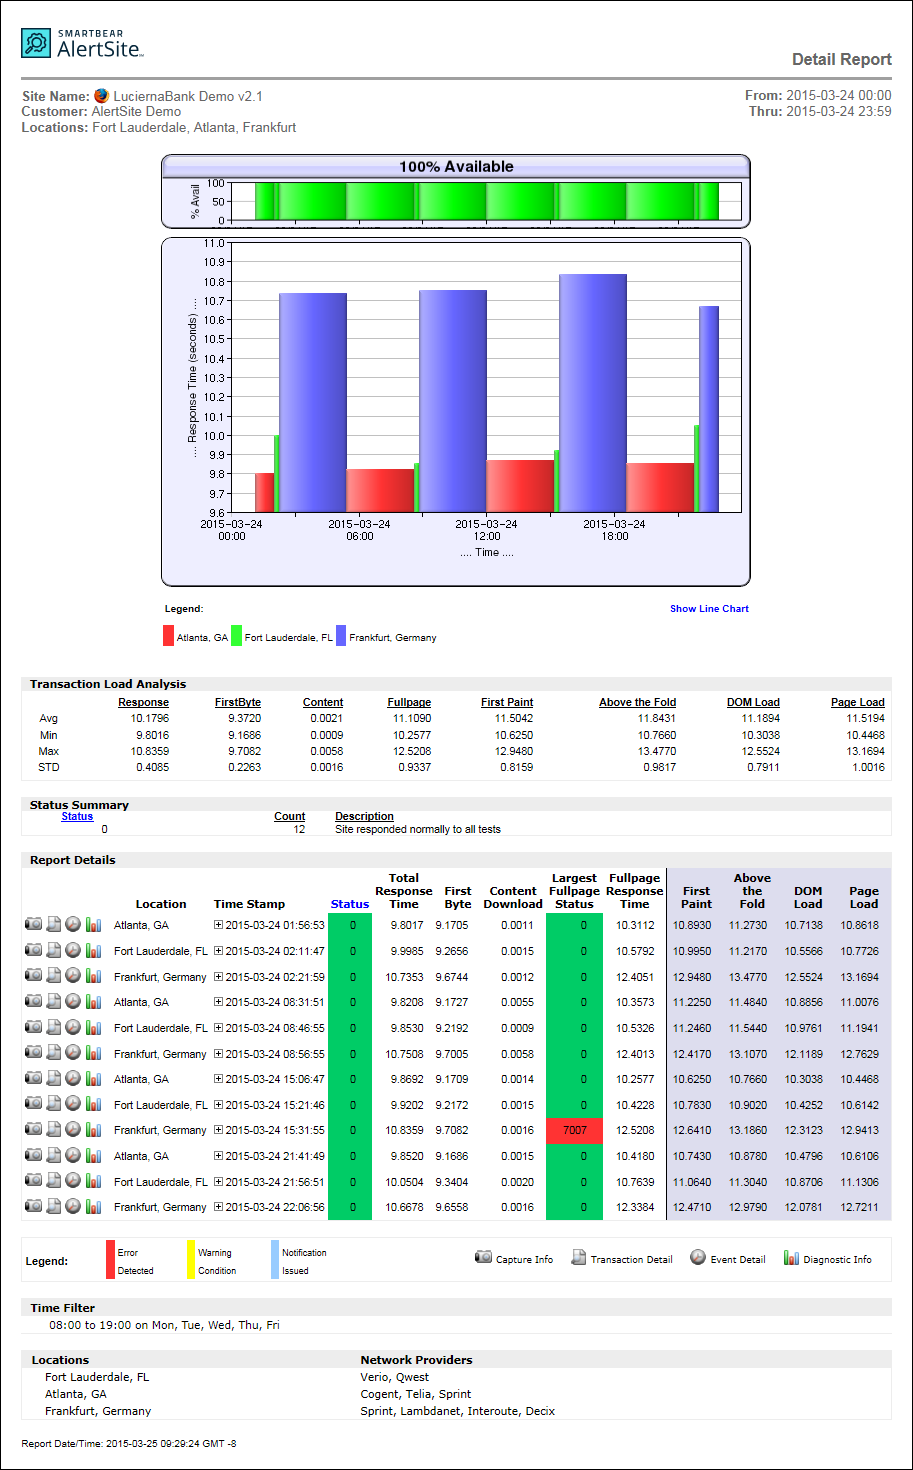
The Detail report shows all monitor runs over the selected period, with the check status (success or error) and the response time breakdown for each run. It is similar to the Daily report, but includes the results of all monitor runs rather than daily averages.
Maximum time span
The Detail report may cover a period up to 31 days. You can run reports for older data up to your data retention period, but the time span that each report covers cannot exceed 31 days. To collect data for larger time periods, you need to run multiple reports.
Create the report
You can view the Detail report for a specific run, or run a cumulative report for a specific period. You can also generate the Detail report programmatically using AlertSite Report API (see below).
View the report for a specific run
AlertSite UXM
Use one of the following methods:
-
Go to Monitors > Runs, expand a run, and click the Detail Report button.
-
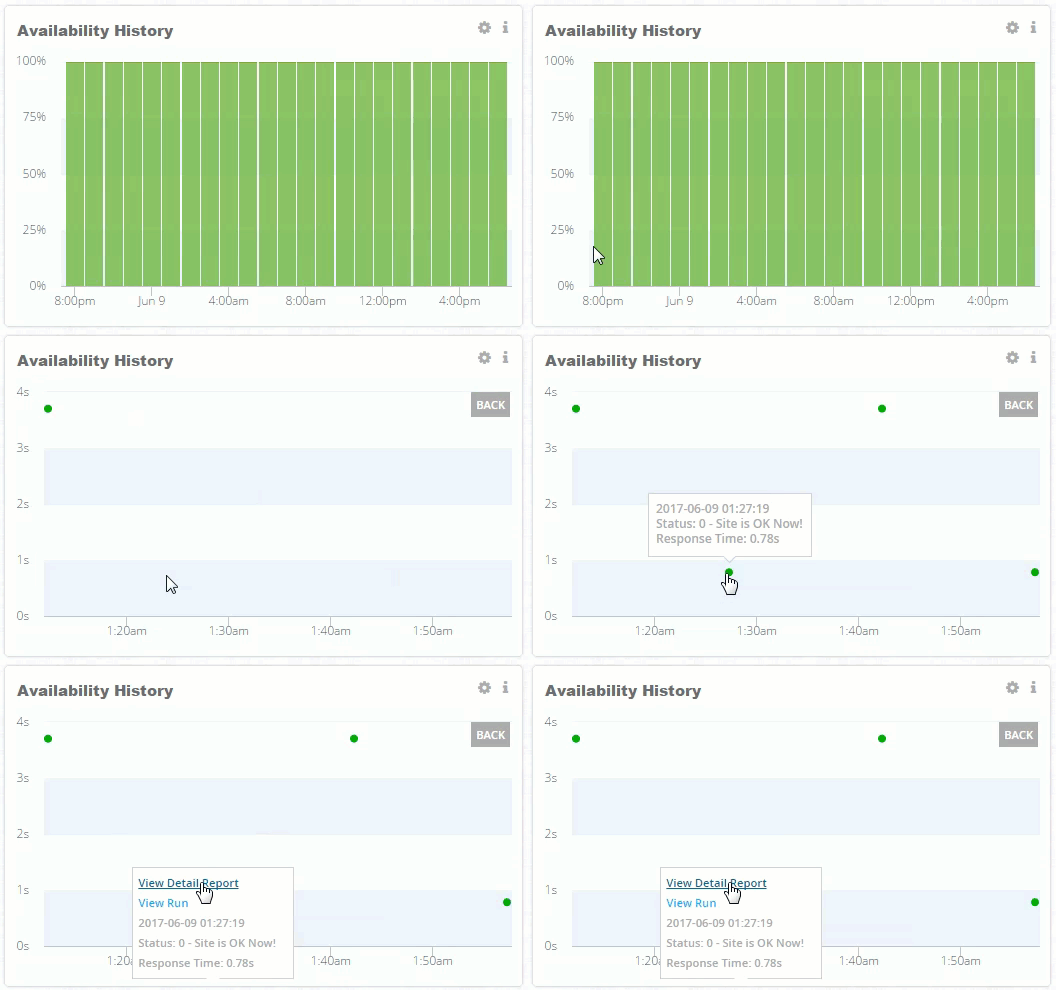
Go to Monitors > Summary, click a time period in Availability History, then click a data point (that represents a monitor run). In the tooltip, click View Detail Report.
-
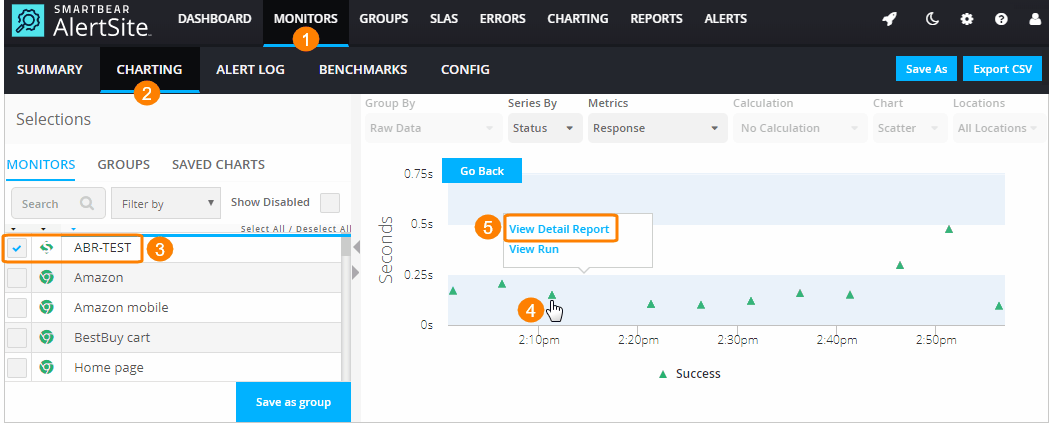
Go to Monitors > Overview > Charting, select the desired monitor and time period, then click a data point to view raw run data for that period. In the raw data, click the data point corresponding to the desired run, then click View Detail Report in the tooltip.
| Note: | Reports opened in this way include only the Report Details table with the response time breakdown and the drill-down links. To get a report with charts or other sections, create a custom report in Reports > Performance Reports, as explained below. |
AlertSite 1.0
Use one of the following methods:
-
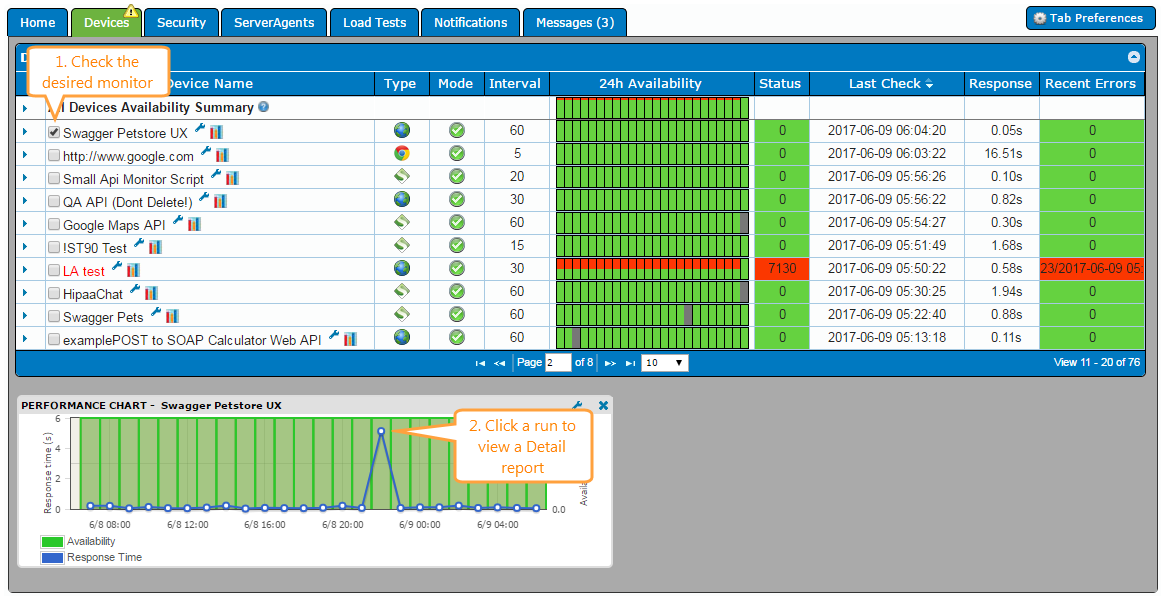
Go to the Devices tab of the Dashboard screen, then check the desired monitor. It shows the Performance chart at the end of the dashboard. Click a data point (that represents a monitor run) to view the Detail report.
-
Go to the Devices tab of the Dashboard screen and click
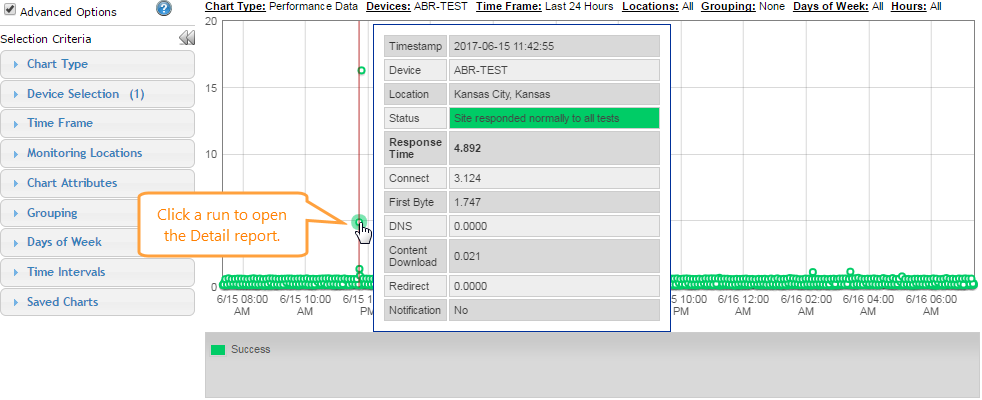
 to view Full Chart. In the Charts window, click a run, to view open the Detail report.
Note: Reports opened in this way include only the Report Details table with the response time breakdown and the drill-down links. To get a report with charts or other sections, create a custom report in Reports > Performance Reports, as explained below.
Create a report that covers a period of time
AlertSite UXM
-
Go to Reports > Performance Reports.
-
Select the Detail report.
-
Configure the report:
-
Select the monitor.
Note: If this is a DéjàClick monitor with ContentViews, you can select a specific ContentView instead. -
Select one or more locations whose data will be included in the report.
-
Select the report time range. You can use a relative period such as Last 7 Days or an exact period up to 31 days.
-
(Optional.) Use the Enhanced Time Controls filter to include or exclude data for specific days of the week or for specific time of the day.
-
Under Report Options, select the sections to include in the report:
-
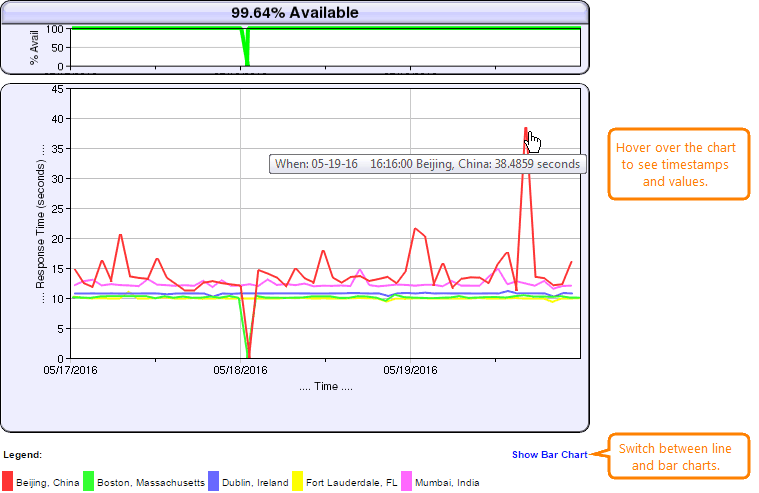
Graphs – A line/bar graph showing the monitor availability and response time over time.
-
Scatter Plot – The same as Graphs, plus a scatter plot with the run results over time.
-
Site (or Transaction) Load Analysis – Response time statistics: minimum, maximum and average values, and standard deviation.
-
Fullpage Time Distribution – Response time distribution across ranges.
-
Status Summary – How many times each monitor status code was received.
-
Report Details – A table listing all run results over the report period.
-
Perceived User Experience – This option adds the user experience metrics in the report – DOM Load, Page Load, First Paint and Above the Fold. It is supported only for real-browser and mobile web monitors (DéjàClick) with UX monitoring enabled.
-
-
- Click Run Report.
AlertSite 1.0
-
Go to Reports > Performance Reports.
-
Select one monitor.
-
Select the Detail report.
-
Configure the report:
-
Select what do you want to include to the report:
-
Graphs – A line/bar graph showing the monitor availability and response time over time.
-
Scatter Plot – The same as Graphs, plus a scatter plot with the run results over time.
-
Site (or Transaction) Load Analysis – Response time statistics: minimum, maximum and average values, and standard deviation.
-
Fullpage Time Distribution – Response time distribution across ranges.
-
Status Summary – How many times each monitor status code was received.
-
Report Details – A table listing all run results over the report period.
-
Perceived User Experience – this option adds the user experience metrics in the report – DOM Load, Page Load, First Paint and Above the Fold. It is supported only for real-browser and mobile web monitors (DéjàClick) with UX monitoring enabled.
-
-
Select one or more locations whose data will be included in the report.
-
Select the report date range. You can use a relative period such as Last 7 Days or an exact period up to 31 days.
-
(Optional.) Set the Time Filter to include or exclude data for specific days of the week or for specific time of of the day.
-
-
Click Create Report.
Once the report is ready, you can view, email, or schedule it. For details, see Scheduling Reports.
The created report will automatically appear at the top of Document Manager. By default, the report will disappear after 30 days, but you can preserve it indefinitely by clicking the (or ![]() ) Save Document icon to the left of the report. Saved reports can be viewed in Documents Manager at any time.
) Save Document icon to the left of the report. Saved reports can be viewed in Documents Manager at any time.
Report data
Report contents depend on the options you selected when creating the report.
Graphs
The top chart shows the monitor availability (OK/error) over time. The bottom chart shows the response time by location. The response time here is the base page response time, not the full page response time.
Scatter plot
If this option is selected, the report will include two charts – a line/bar chart (the same as the one added by the Graphs option) and a scatter plot.
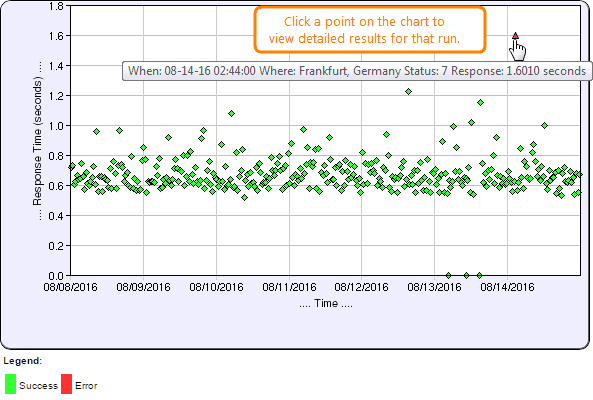
The scatter plot shows the monitor status (a green diamond ![]() for success, a red triangle
for success, a red triangle ![]() for error) and response time over the selected time period. Clicking a data point opens a report with the run details.
for error) and response time over the selected time period. Clicking a data point opens a report with the run details.
Site/transaction load analysis
Supported monitor types: website, real-browser (DéjàClick), and API monitors.
This section shows the average, minimum and maximum response times observed during the report period, and the standard deviation of the response times (measurement of how spread the numbers are). For a description of the response time components (DNS, Connect, and others) see Web Page Load Time. Note that the Response column here shows the base page response time, not the full page response time.
Note: This data includes only successful tests (with status 0).
Fullpage time distribution
This section is included:
-
For website and real-browser (DéjàClick) monitors that use full-page response time measurement (enabled by the Fullpage Interval option).
-
If there is at least one successful run (with status 0) in the report.
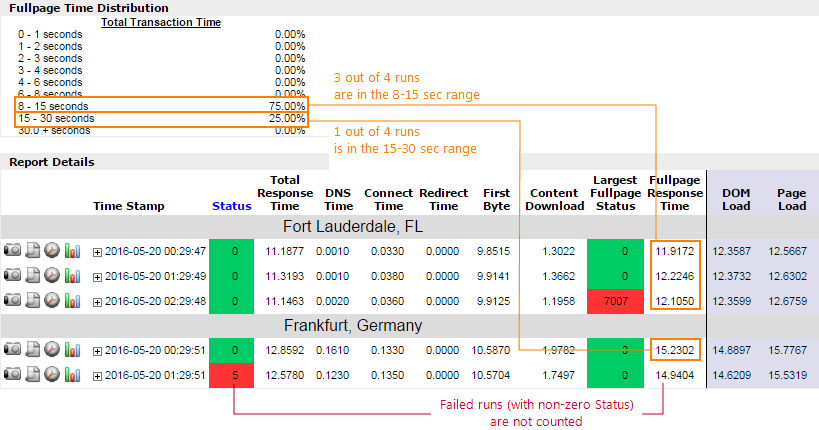
It groups the full-page response time of the monitor and its individual pages into nine ranges from 0 to 30+ seconds, so you can see the distribution across these ranges. Each range includes the starting value but not the ending value, that is, "min–max" means "min ≤ ... < max".
Transaction total time
This section shows the distribution of Fullpage Response Time of successful monitor runs (status 0) across various time ranges. A monitor’s full-page response time is the sum of the full-page response times of all monitor steps. This time includes all network components and content download times for all pages, images, scripts, CSS, and other content loaded by the monitor.
Individual page time
To understand this section, first, let’s see what an "individual page" is. Real-browser (DéjàClick) monitors use the following terms:
-
Monitor (or transaction)
-
Step (or action in DéjàClick terms) – Anything that changes the URL and navigates to (displays) a new page, typically, clicking a link or entering a new URL directly.
-
Event – Anything that happens within a page, for example, a mouse hover, text input, form submission, click to display a dropdown, and so on. Some events trigger network activities, which leads us to:
-
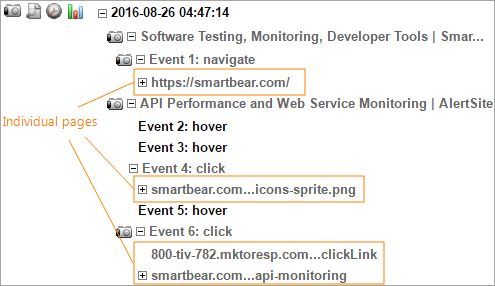
Individual pages (or HTTP Steps in DéjàClick terms, not to be confused with HTTP requests) – These are network activities triggered by events. For example, a navigate event always loads a new page. A link click may also load a new page, or it may trigger an Ajax request to load some additional content into the current page. The new content being loaded as a result of the event is referred to as "individual pages" in the report.
In general, a single event may trigger several individual pages if that event makes different types of requests to different servers.
-
-
-
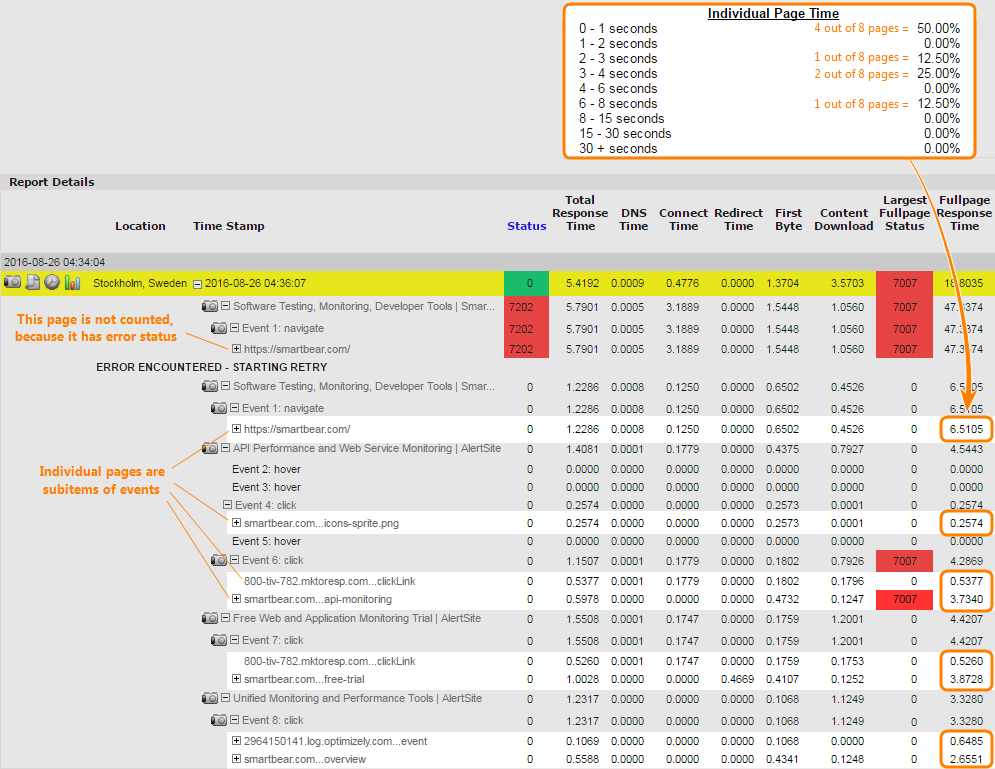
To see the individual pages of your monitor, expand the entries in Report Details down to events. The individual pages are the immediate child items of events.
The Individual Page Time section breaks down the individual pages into ranges from 0 to 30+ seconds based on their full-page response time. This is calculated as follows:
-
Get a list of all individual pages from all monitor runs in the report – both successful and failed runs, both first and second attempts (for monitors with local retry enabled).
-
Exclude individual pages with an error status (the Fullpage Status and the overall monitor status do not matter).
-
Calculate the percentage for each of the response time ranges.
Status summary
This section shows how many times each monitor status code was received. Note that this does not include fullpage monitoring statuses (7xxx).

Report details
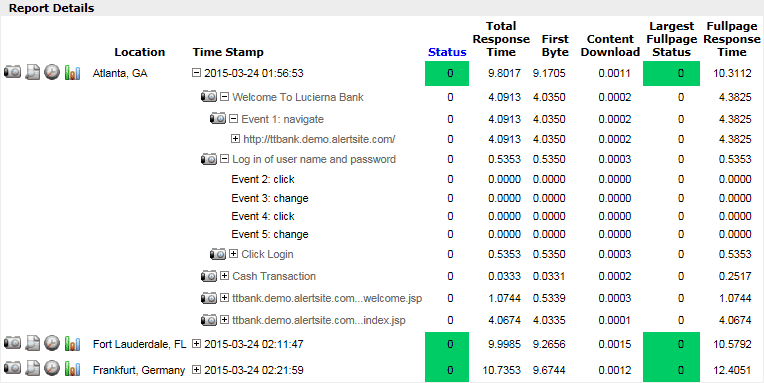
This table lists all monitor runs over the selected period, with the status code and response time breakdown for each run.
Error statuses 21, 90, 95 and 6061 indicate the times when a scheduled test could not be performed. However, they are not included in monitor availability calculation.
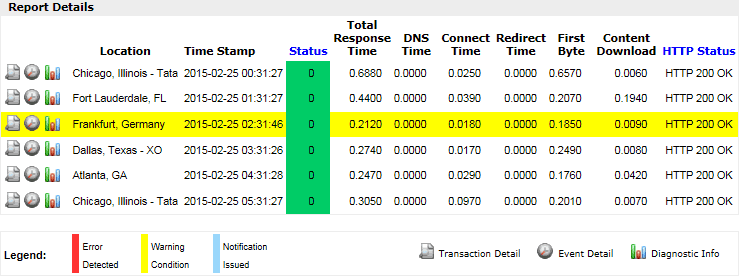
In reports for DéjàClick, SoapUI and BitBar monitors, you can expand the runs to view results of individual test steps and HTTP requests.
Time filter
This section appears if the report was created with the Enhanced Time Controls filter enabled. It shows the days of the week and the time of the day included in or excluded from the report.
Report columns
For a description of the report columns, see Report Column Descriptions.
Report API
You can get the report data in XML or JSON format using AlertSite Report API. For example, the following URL returns XML data for customer ID C12345, device ID 76981, from Atlanta, Boston and Chicago (IDs 20, 72 and 50), for yesterday:
https://www.alertsite.com/report-api/detail/C12345?&obj_device=76981&location=20,72,50&rdate=Yesterday
You can open this link in the browser, and the XML report data will be displayed. Make sure to replace the highlighted values with your actual values:
-
The customer ID is displayed on the > Settings > Account screen.
-
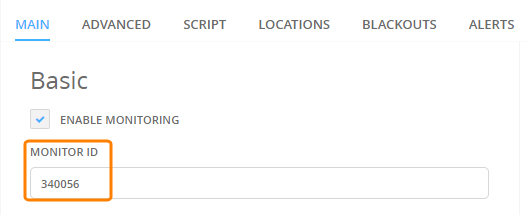
The monitor ID appears in the browser’s address bar if you go to Monitors > Summary and select your monitor.
-
Locations IDs can be found here.
To download the report using cURL or similar tools, include your AlertSite login and password for authentication:
curl -o report.xml -u [email protected]:password "https://www.alertsite.com/report-api/detail/C12345?&obj_device=76981&location=20,72,50&rdate=Yesterday"
For more information and examples, see Get Detail Report.
See Also
Report Types
Creating Reports
Scheduling Reports
AlertSite Status Codes




 Example