The AlertSite fullpage monitoring feature allows you to gather detailed performance data about the web page and all its elements. In general, it commands devices to use the real browser to download each element on the page, including:
- scripts
- images
- CSS files
- Flash objects
With the fullpage monitoring enabled, you will receive alerts if AlertSite detects errors on any objects on the page. These errors can also be remotely verified and configured.
On the usage-based monitoring plans, the fullpage monitoring consumes the double amount of credits required to perform the monitor runs.
Enable Fullpage Monitoring
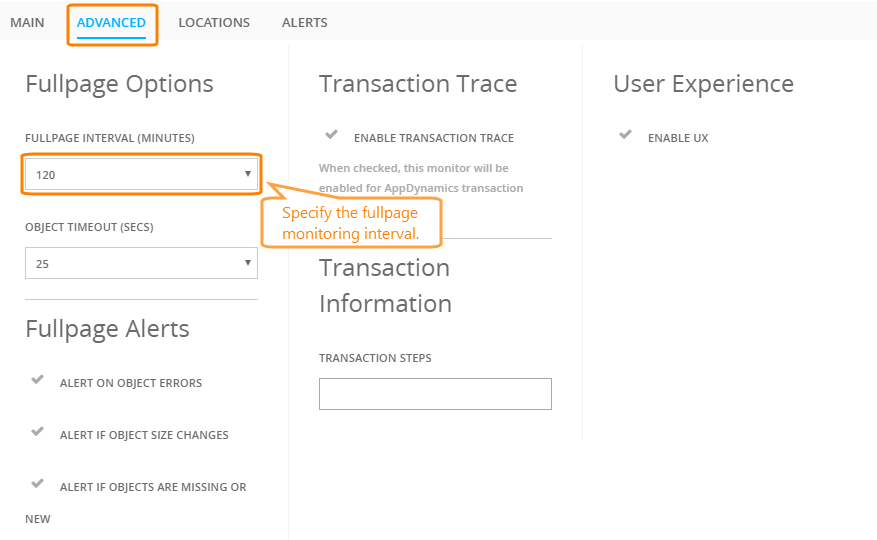
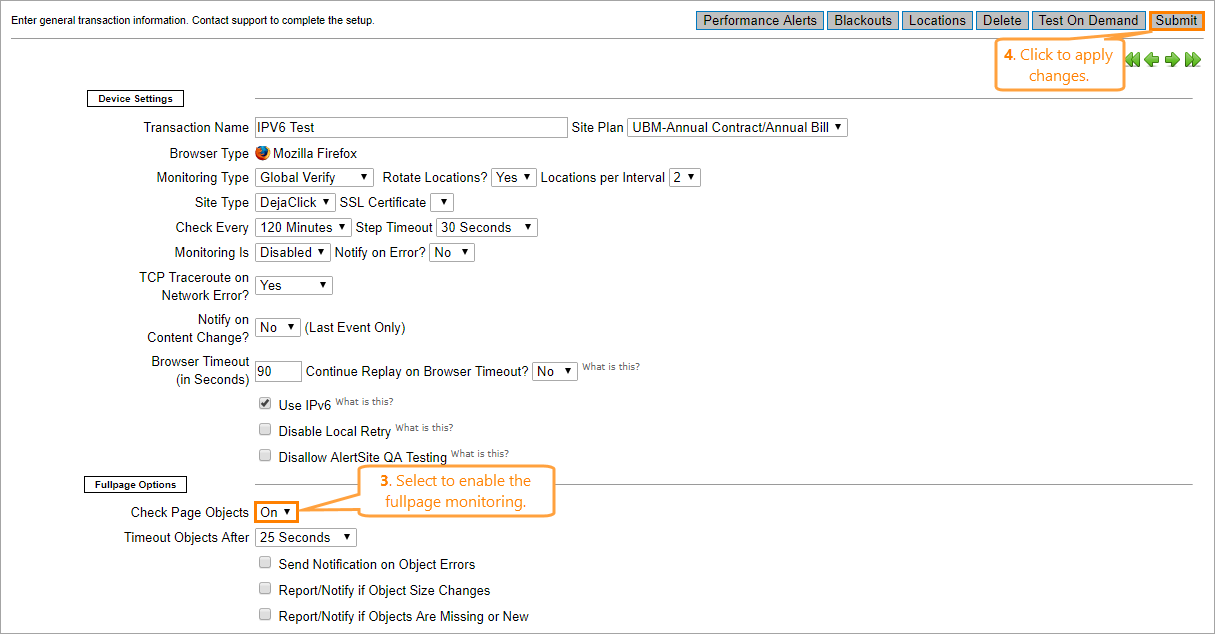
To enable the fullpage monitoring:
AlertSite UXM
Configure Fullpage Monitoring
If your monitor has the fullpage monitoring enabled, you can specify the maximum allowed timeout for objects to load and when the alerts should be sent.
Specify Object Timeout
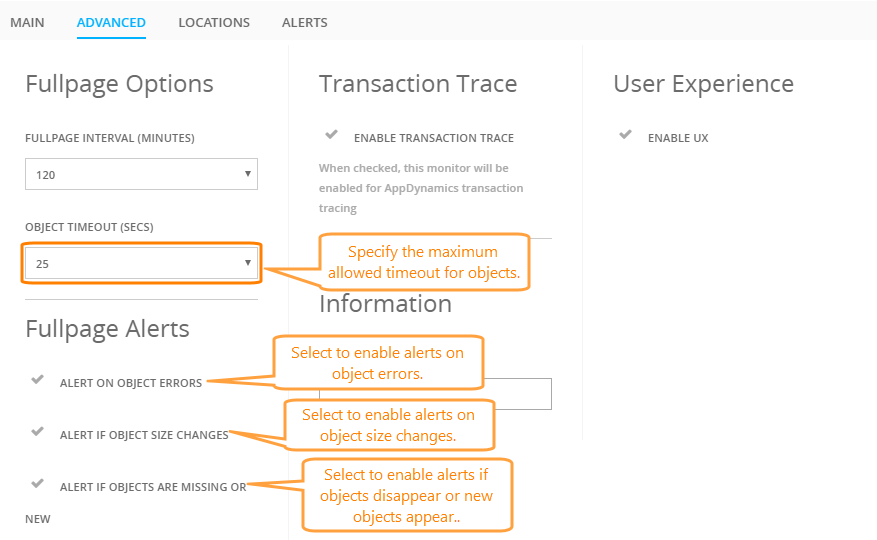
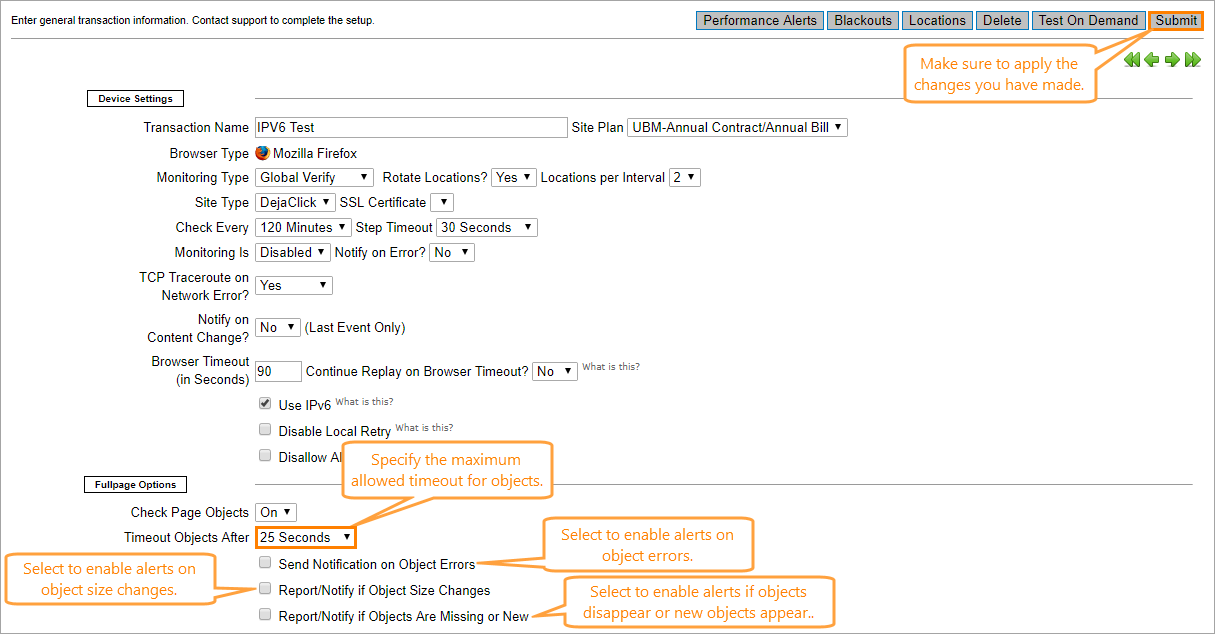
To define the maximum allowed object timeout, select the timeout value in the Object Timeout (AlertSite UXM) / Timeout Objects After (AlertSite) drop-down list in the Fullpage options section of the monitor settings page.
Enable Alerts
There are multiple cases which AlertSite recognizes as errors and sends alerts. You can specify when it should send alerts on the monitor settings page:
-
If object errors occur: Select the Alert on Object Errors (AlertSite UXM) // Send Notification on Object errors (AlertSite 1.0) check box.
-
If object size changes: Select the Alert if Object Size Changes (AlertSite UXM) // Report/Notify if Object Size Changes (AlertSite 1.0) check box.
-
If object are missing or new object appears: Select the Alert if Objects are Missing or New (AlertSite UXM) // Report/Notify if Objects Are Missing or New (AlertSite 1.0) check box.
 |
We do not recommend to enable these alerts unless your web page is completely static, since with these options enabled the alerts will trigger on every object change. |
| Tip: | If making any changes, do not forget to click Submit (in AlertSite 1.0) or Save (in AlertSite UXM) so your changes will be applied in the service. |
View Results
To view the fullpage monitoring results and statistics:
-
In AlertSite UXM, go to Monitors > Runs.
-
Select your monitor from the list in the top left corner.
-
Click a run in the list.
-
Click Run View to open the dialog with the run data.
-
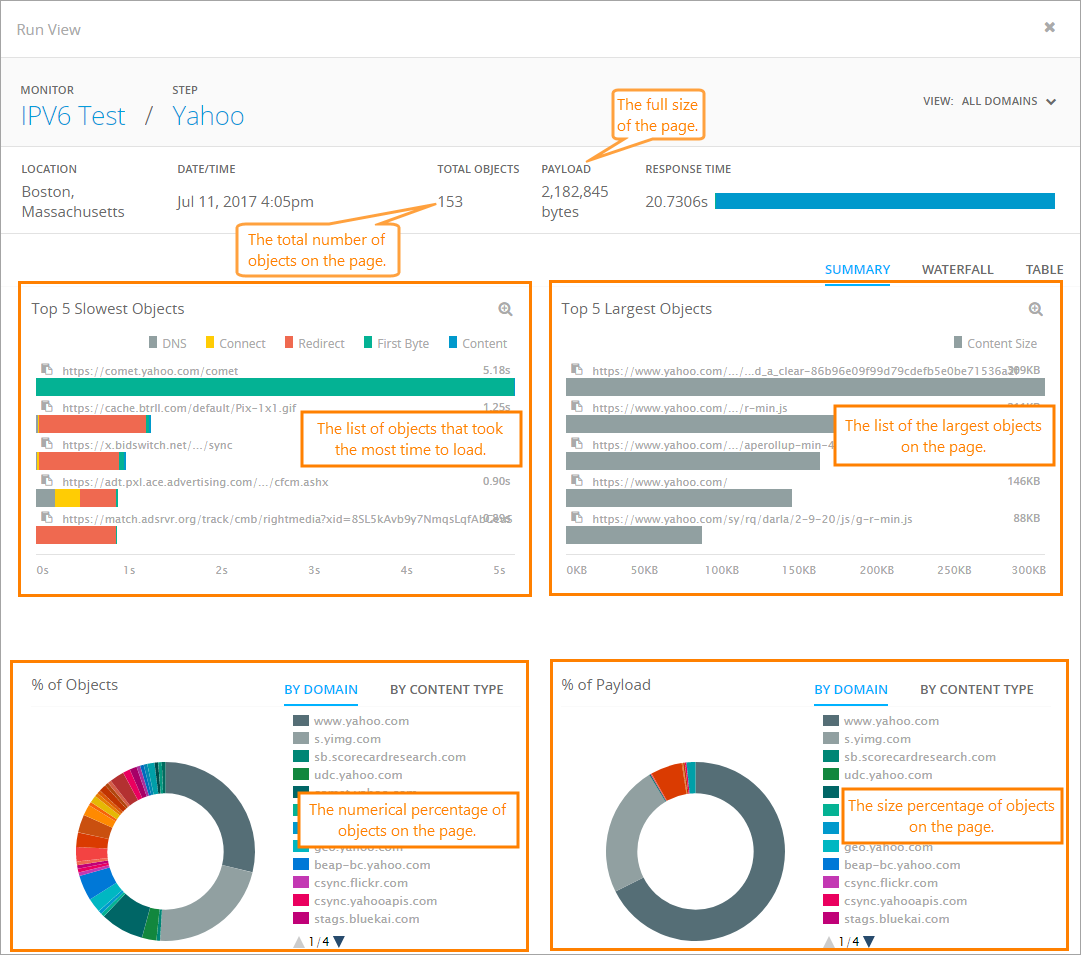
In the dialog, you can see the information on objects on the page.
-
Total Objects shows the number of objects on the page.
-
Payload shows the full page size.
-
In the Top 5 Slowest Objects list, check the objects that took the most time to load.
-
In the Top 5 Largest Objects list, check the objects that have the largest size.
-
In the % of Objects chart, view the percentage of objects on the page. Switch between tabs to view objects by domain or by content type.
-
In the % of Payload chart, view the percentage of objects size on the page. Switch between tabs to compare objects size by domain or by content type.
-
-
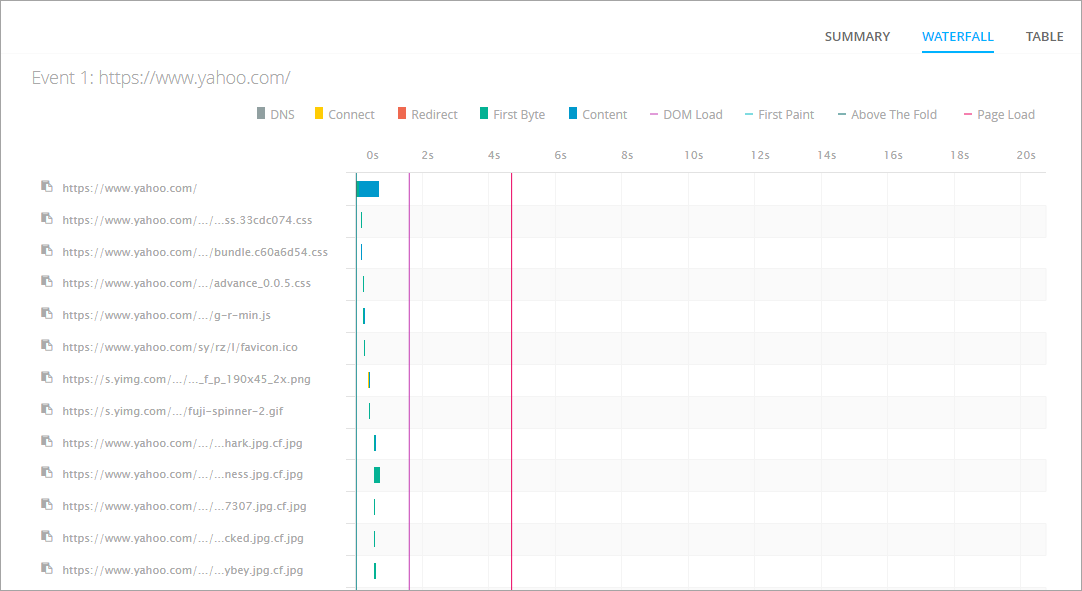
Switch to the Waterfall tab to view additional information about page objects. To learn more about the metrics available on that tab, see Web Page Load Time.
-
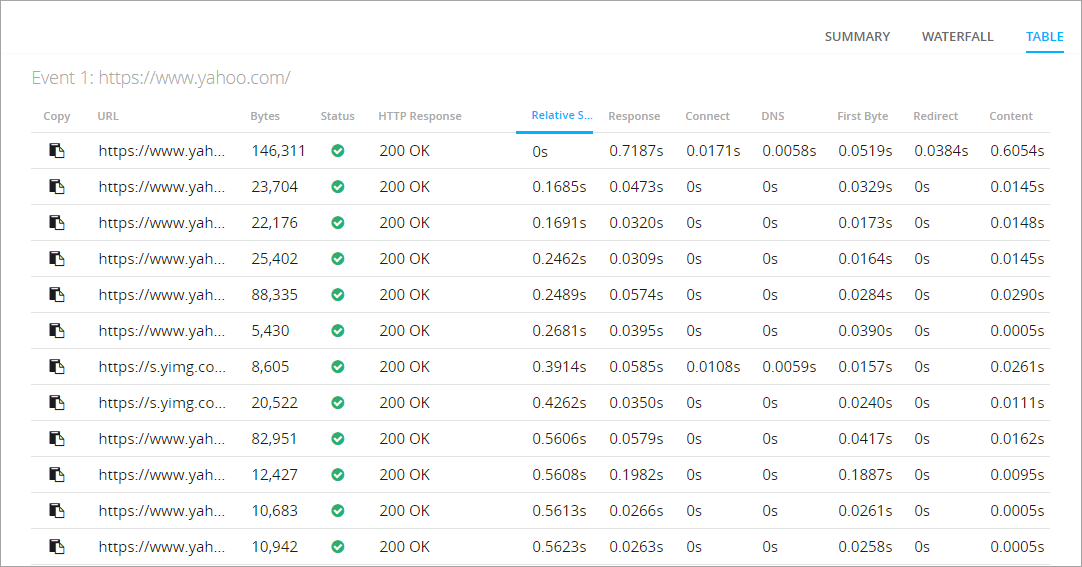
Switch to the Table tab to get the list of page objects in a table view, including information such as objects size, the loading time, and so on.
Status Codes
Fullpage monitors can report four-digit status codes in the 7xxx series. To view the list of possible codes and their descriptions, see Fullpage Monitoring Status Codes.
See Also
Selenium Monitors
Transaction Monitors
Single URL Monitors
Website Monitoring

