AlertSite sends performance alerts when a website response time exceeds a user-defined threshold (static or dynamic). Performance alerts do not indicate a hard error, such as timeouts or content errors, but tell you when your site is slower than usual. Performance alerts are similar to SLAs, but while SLAs are used for reporting purposes, alerts let you proactively identify performance problems and take action.
Performance alerts are disabled by default; you can enable them in the monitor settings. In multi-step monitors (such as real-browser monitors and SoapUI API monitors), you can set performance thresholds for the entire test and also individual steps.
| Note: | Performance alerts do not follow alert blackout rules (neither monitor blackouts nor recipient blackouts) and are sent during the blackout periods too. |
Static vs dynamic thresholds
To check the monitor performance, AlertSite compares its response time with a predefined threshold. Thresholds can be static or dynamic:
-
Static – A fixed value in seconds. Use this mode to alert if the response time is N seconds or more.
-
Dynamic – In this mode, AlertSite compares the current response time with the average response time for the past 1 to 7 days. An alert is sent if the current value exceeds the past performance by at least N%.
In monitors with 2 or more locations, thresholds apply to each location individually, and an alert is sent only if the specified number of locations exceeds the threshold. The alert message will list all locations that exceeded the threshold during the measurement period.
Current response time
To measure the current performance, AlertSite does not just consider the latest response time, but instead calculates the average response time over a user-defined time period, from last 10 minutes to 24 hours. This helps avoid false positives due to local connectivity issues.
Response time is calculated for each location individually, and the number of locations is taken into account for alert conditions. If you are using rotated locations, see considerations below.
Enable or disable performance alerts
You can enable or disable performance alerts and set performance thresholds in the monitor settings.
AlertSite UXM
-
On the Dashboard, click on the monitor tile and select Edit Configurations.
–or–
Click Edit Monitor on the Monitor Summary, Monitor Availability, or Monitor Performance dashboard.
-
Switch to the Alerts tab.
-
Click Monitor Alerts or Step Level Alerts, depending on whether you want to set performance alerts for the entire monitor or individual test steps.
Note: Step-level alerts are supported only for real-browser monitors (DéjàClick), mobile web monitors and SoapUI API monitors. -
Under Performance Alerts, select Enable or Disable.
-
Configure the performance alert settings (see below).
-
Click Save to save the changes.
AlertSite 1.0
-
On the Dashboard, click the icon next to the monitor you want to set performance alerts for.
–or–
From the top menu, select Configure and the needed monitor type. Then click the monitor name.
-
Click Performance Alerts at the upper right.
-
Under Enable/Disable Performance Alert processing, select enable or disable.
-
Configure the performance alert settings (see below).
-
Click Submit at the upper right.
Examples
Alert if the response time exceeds 8 seconds
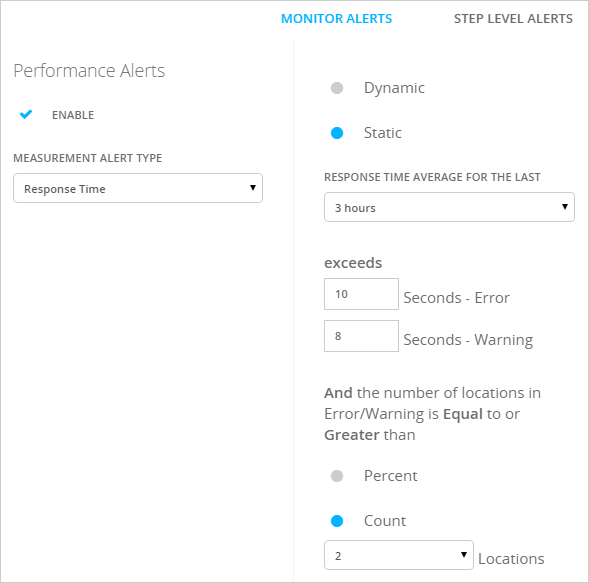
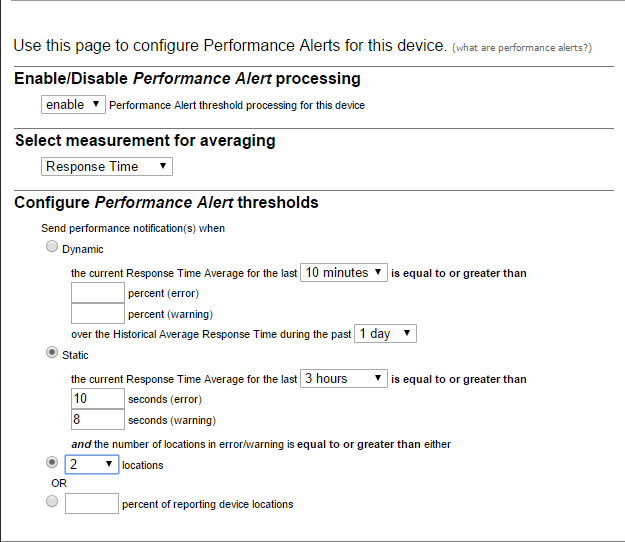
This example uses static thresholds for the monitor response time: 8 seconds for a warning and 10 seconds for an error. Current response time is calculated as an average for the last 3 hours, and an alert is sent when 2 or more locations report threshold exceeded conditions.
Alert if the response time of the first step exceeds the norm by 20%
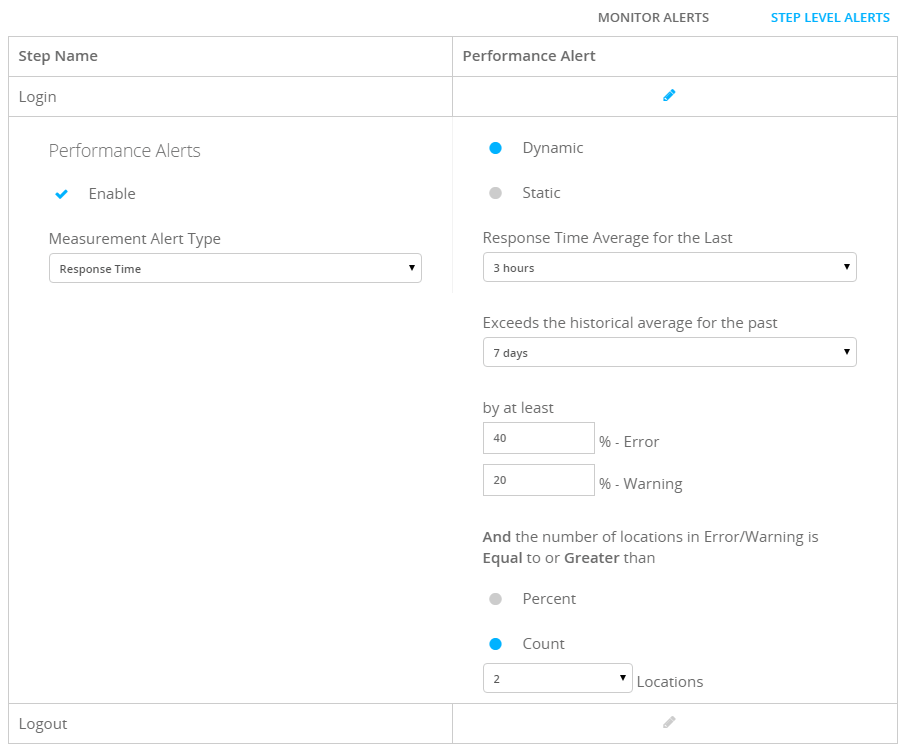
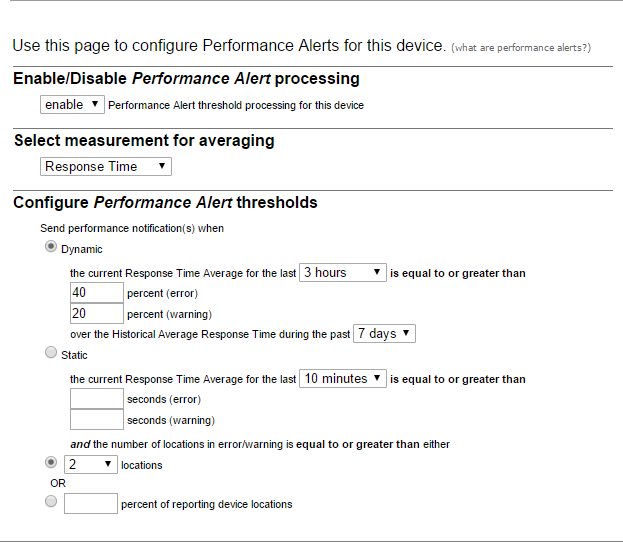
In this example, the Login step uses dynamic thresholds for the response time: 20% for a warning and 40% for an error. So, if the normal response time is 10 seconds, a warning condition is 12 seconds or more (12 seconds are 20% more than 10 seconds), and an error condition is 14 seconds or more.
Current response time is calculated as an average for the last 3 hours, and normal response time – as an average for the past 7 days. An alert is sent when 2 or more locations report threshold exceeded conditions.
Performance alert settings
Enabled
Enable or disable performance alerts for this monitor or step.
Measurement Alert Type (or Select measurement for averaging in AlertSite 1.0)
The metric to set thresholds for. It can be the response time or one of its components. The most common metrics are Response Time and Fullpage Response Time (the response time of the entire page including images, stylesheets and other external resources). The available metrics depend on the monitor type.
| Metric | Web Monitors | API Monitors | Mobile Monitors | Email, FTP, Network Monitors | |||
|---|---|---|---|---|---|---|---|
| URL | Real-Browser (DéjàClick) | Selenium | Mobile Web | BitBar | |||
| Response Time | ✔ | ✔ | ✔ | ✔ | ✔ | ✔ | ✔ |
| Fullpage Response Time | Only monitors with fullpage monitoring (Fullpage Interval > 0) |
Only monitors with fullpage monitoring (Fullpage Interval > 0) |
✔ | Only monitors with fullpage monitoring (Fullpage Interval > 0) |
|||
| DNS Time | ✔ | ✔ | ✔ | ✔ | ✔ | ✔ | |
| Connect Time | ✔ | ✔ | ✔ | ✔ | ✔ | ✔ | |
| First Byte | ✔ | ✔ | ✔ | ✔ | ✔ | ✔ | |
| Content Download | ✔ | ✔ | ✔ | ✔ | ✔ | ✔ | |
| DOM Load | Firefox monitors only | ✔ | Firefox monitors only | ||||
| Page Load | ✔ | ✔ | ✔ | ||||
| First Paint | Firefox monitors with the Enable UX? option selected |
Firefox monitors with the Enable UX? option selected |
|||||
| Above the Fold | Firefox monitors with the Enable UX? option selected |
Firefox monitors with the Enable UX? option selected |
|||||
Dynamic
Select the dynamic mode to compare the monitor’s current response time with its previous performance.
Static
Select the static mode to use fixed thresholds. For example, 7 seconds for a warning and 10 seconds for an error.
Response time average for the last
The time frame to calculate the current response time. Possible values: last 10 minutes up to 24 hours.
 |
AlertSite calculates the current response time for each location individually. When monitoring with rotated locations, use a larger time frame to ensure a sufficient sample size. See the considerations below. |
Exceeds the historical average for the past
Used only in the Dynamic mode. The time frame (from 1 to 7 days) to calculate the monitor’s normal response time. The current response time will be compared against this value.
Error and warning thresholds
Response time thresholds that will trigger performance alerts. Both warning and error thresholds are required, and warning thresholds must be smaller than error thresholds.
-
In the static mode, enter specific values in seconds. For example, 10 seconds. To learn your typical response time, review run results on the Monitor Runs dashboard.
-
In the dynamic mode, specify the difference in percent, over the normal response time. For example, if your normal response time is 10 seconds, and you want to get an error at 14 seconds, specify 40% (the additional 4 seconds are 40% of the 10-second norm).
Locations in error/warning
The minimum number of locations that must be in an error or warning to trigger a performance alert. You can specify a fixed number, or a percentage of the total number of locations.
For example, if a monitor runs from 10 locations, and you want to get an alert if 2 or more locations are in an error at the same time, enter Count = 2 or Percent = 20%.
Configure recipients for performance alerts
AlertSite can send performance alerts via the following notification methods:
- E-mail (HTML format)
- E-mail (text format)
- E-mail to wireless device
- POST request to web server
- POST JSON request to web server
- ServiceNow
- Splunk
Alert recipients need to have performance alerts enabled in their settings. To configure a recipient to get performance alerts:
AlertSite UXM
-
Select Alerts > Alert Recipients from the top menu.
-
(Optional) To add a new recipient, click New Recipient and enter the contact details.
-
Click next to the created recipient in the table.
-
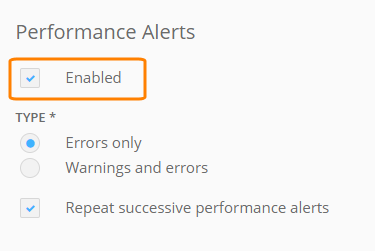
In the Performance Alerts column, select Enabled.
-
Choose to receive Errors only or Warnings and errors. Warnings and errors have different response time thresholds.
-
Select Repeat successive performance alerts to continue receiving alerts while a performance problem remains. Otherwise, the recipient will get only one alert when the problem starts and a “clear” notification when the response time is back to normal.
-
To send only performance alerts but not availability alerts to this recipient, unselect Enabled in the Availability Alerts column.
-
Click Save.
AlertSite 1.0
-
From the top menu, select Notifiers > Notifiers.
-
To create a new recipient, click the Add Notifier button at the upper right.
-
Enter a Description.
-
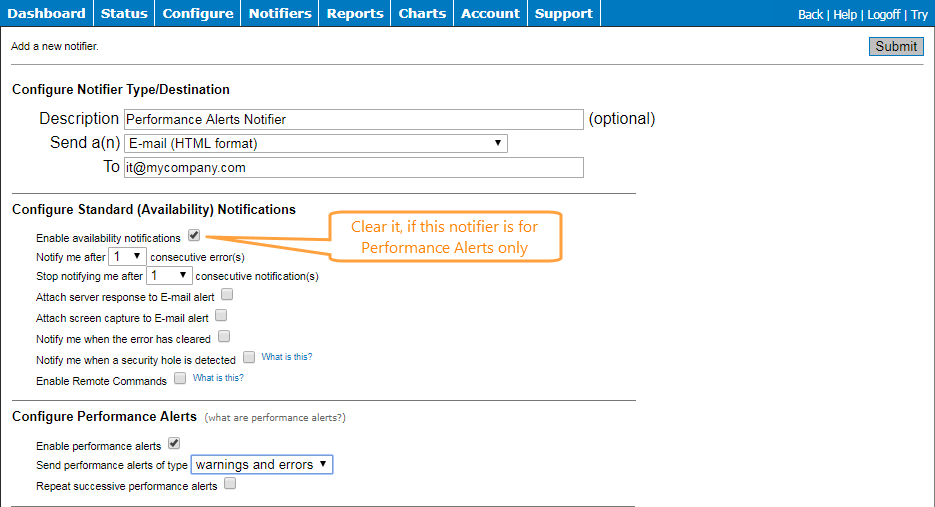
Leave Send a(n) as E-mail or select E-mail to wireless device (cell phone, pager, Blackberry, and so on).
-
Enter an email address in the To field.
If this is going to be a Performance Alert-specific recipient, clear the Enable availability notifications check box in the Configure Standard (Availability) Notifications section.
In the Configure Performance Alerts section:
-
Select the Enable performance alerts check box.
-
Select errors only or warnings and errors from the Select performance alerts of type drop-down list.
-
Select the Repeat successive performance alerts check box if you want to continue to receive Performance Alerts, otherwise leave it blank.
To configure an existing recipient, click on the recipient in the Notification Method column, then complete the Configure Performance Alerts section as described above.
| Note: | By default, each recipient gets alerts from all monitors, but you can target alerts to specific recipients by creating recipient groups. |
Alert templates
You can customize the contents of performance alerts for the following delivery methods:
- POST JSON request to web server (JSON alerts)
- ServiceNow
See Alert Templates to learn how to create and edit the templates.
| Note: | For the custom templates to have effect, you need to either set them as default, or create a recipient group that combines the desired monitors, recipients, and custom templates. |
Considerations for API monitors
ReadyAPI and SoapUI tests can include Response SLA assertions to verify that the API response time is within the specified value. AlertSite API monitors handle Response SLA assertion failures as availability errors with status 2 “Test timed out”, so they trigger availability alerts. If you want the high response time to trigger performance alerts instead, disable Response SLA assertions in your API test before uploading it to AlertSite and configure the performance thresholds in the monitor settings.
Considerations for rotated locations
When monitoring with rotated locations, consider the monitoring interval and number of monitoring locations when selecting the time frame to calculate the current response time (the Response time average for the last setting). For example, say your monitor is configured as follows:
- 5-minute monitoring interval
- 12 monitoring locations
- Rotating 1 location per interval
And the performance thresholds for the monitor are configured as follows:
-
Alert on the Fullpage Response Time metric
-
Static thresholds:
- 5 seconds for error
- 3 seconds for warning
-
Calculate the current response time for the last 10 minutes
-
Alert when 1 location exceeds the threshold
With this setup, there are 12 tests in an hour, and each location runs only once per hour. Because performance thresholds apply to each location individually, 10 minutes may not be an adequate sample size – it includes only the latest run from the location. In this case, you would receive an alert as soon as any location exceeded the threshold.
Consider what sample size is appropriate for your purposes. If you are looking at trends rather than a single event, use a longer time period for the response time average. In the above example, Last 6 Hours would provide a more useful sample size to determine performance trends. This way, each location will run about 6 tests. For example:
-
Over the last 6 hours, all locations except for Los Angeles ran 6 tests and returned Fullpage Response Time of 3 seconds or less.
-
Over the last 6 hours, Los Angeles returned the following values for its 6 tests:
- 1.6789
- 4.4532
- 2.0051
- 3.1008
- 1.9855
- 4.9982
-
The average Fullpage Response Time in Los Angeles is 3.03695 seconds, which is over the 3-second warning threshold.
-
A warning is sent showing Los Angeles averaged 3.037 seconds over the last 6 hours.
-
If another location exceeded the Fullpage Response Time threshold over the same 6 hours, it would be listed in the same alert.

