Splunk collects and indexes machine-generated big data from your infrastructure and applications – websites, servers, databases, networks, custom applications and other sources. Splunk platform provides data search, analysis and visualization capabilities for real-time and historical insight into your business and IT metrics.
AlertSite can be configured to send monitoring alerts to Splunk. With this integration, you can more easily match website availability and performance problems with the system log events around that time.
Requirements & limitations
-
Splunk integration is available on AlertSite Enterprise (Usage-Based Monitoring) plans. You must be an AlertSite Admin, Co-Admin, or Power User to configure the integration.
-
If you use self-hosted Splunk:
-
Your Splunk server must be accessible from the Internet.
-
If Splunk is behind a firewall, the firewall must allow traffic on the Splunk management port (default is 8089). AlertSite locations send data to Splunk through this port.
-
-
Private nodes (Private Node Server and InSite) support Splunk alerts starting from version 2.0.
Splunk user account for integration
AlertSite needs a user account to send data to Splunk. The account you can use depends on your Splunk edition.
-
If you use Splunk Cloud (paid subscription), contact Splunk Support and ask for the REST API credentials. This is the account you will need to specify in AlertSite.
-
If you use Splunk Light Free, it supports a single administrator account and does not support additional user accounts. You will need to specify the admin account in AlertSite.
-
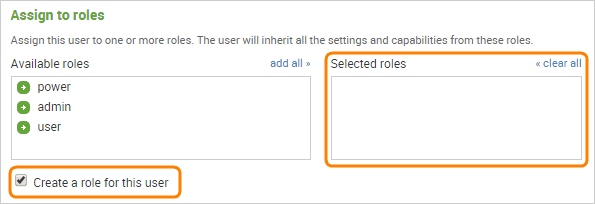
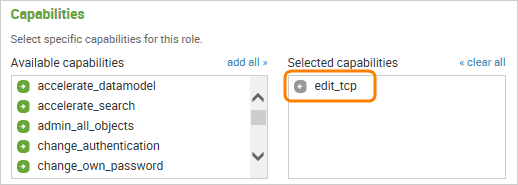
In other Splunk editions, you will need a user account with the edit_tcp capability. By default, only Splunk administrators have this capability, and regular users do not. For security reasons you may want to create a separate user with just the edit_tcp capability, so that it can only be used to post data to Splunk.
Configure AlertSite source type in Splunk
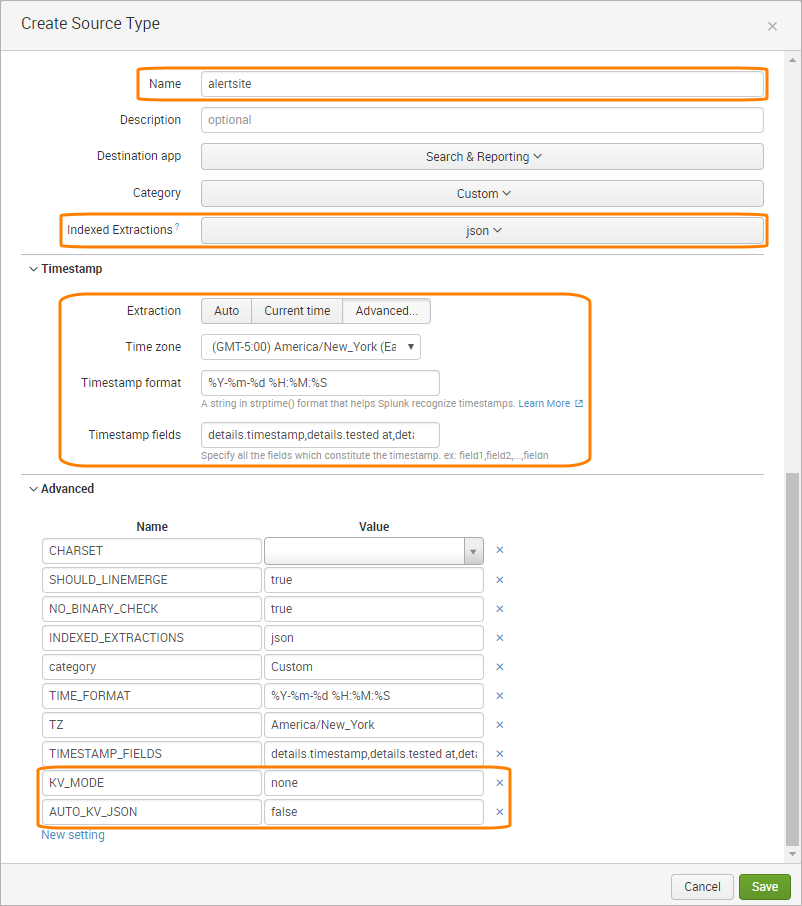
You need to create a new source type in Splunk for AlertSite data so Splunk can properly parse AlertSite alerts and extract timestamps. You can add source types in Splunk web interface, or by editing the props.conf file.
Add Splunk as alert recipient in AlertSite
-
Log in to AlertSite UXM.
-
From the top menu, select > Manage Integrations.
-
Click
 in the integrations list.
 -
In the dialog that opens, click New Recipient.
-
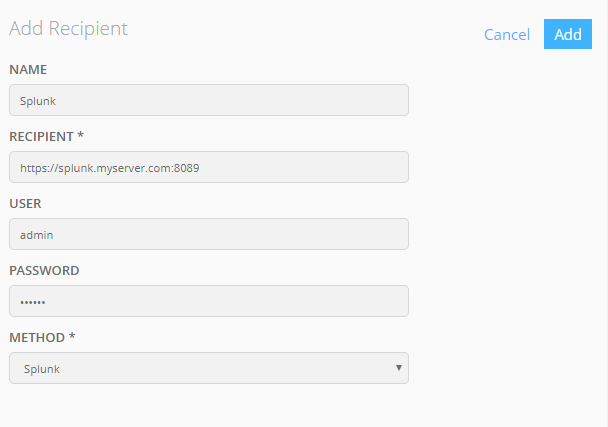
Enter your Splunk server information.
Setting Description Name An optional display name for your Splunk server. Splunk URL Your Splunk server URL, including the prefix (https:// or http://) and the Splunk management port (default is 8089). For example:
https://splunk.myserver.com:8089
Note: The management port differs from the web port used to access Splunk in web browsers. See Network ports in Splunk documentation.
User and Password A user account on your Splunk server that will be used to post data to Splunk. This can be an admin account or any account with the edit_tcp capability (see above). LDAP and SAML accounts are not supported. -
Click next to the created recipient.
-
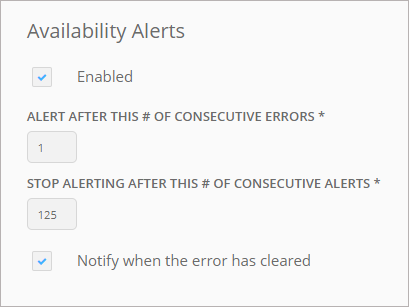
In the Availability Alerts column, select how many consecutive alerts to send to Splunk, and whether to send a “clear” notification. For a description of available settings, see Recipient Properties.
-
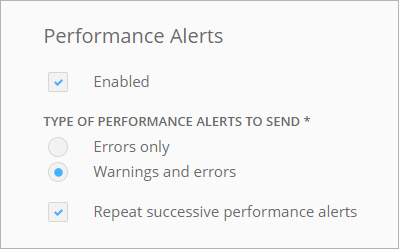
To receive performance alerts, enable them in the Performance Alerts column. Select which alert types to receive and whether to repeat successive performance alerts.
-
Click Save.
That’s it! Splunk will now receive alerts from your AlertSite monitors.
Tips:
-
To receive alerts from specific monitors rather than all monitors, you can create a recipient group containing Splunk and the needed monitors.
-
If you use several Splunk servers, you can add them as individual recipients.
-
Splunk recipients also appear in your global recipient list in Alerts > Alert Recipients, and you can manage them from there.
View alerts in Splunk
You can view and analyze AlertSite monitor alerts using Splunk’s search engine. For a description of fields included in alerts, see Alert Data Fields. You can find sample alerts below.
Default Splunk fields are set to:
sourcetype– alertsite.source– the monitor ID, or www for test alerts.-
host– the IP address of the monitoring location that sent the error. You can see our IP addresses here.Note: hostis not necessarily the same as the location that found the error (details.location). For example, in the Global Verify mode, alerts are always sent from the primary location even if the error was found at another location.
Sample Queries
Find alerts from all AlertSite monitors:
sourcetype=alertsite
Alerts from the Home Page monitor:
sourcetype=alertsite details.device_name="Home Page"
Alerts triggered from London:
sourcetype=alertsite london
Sample Alerts
Example of an availability alert:
{
"service_key": "https://splunk.myserver.com:8089/",
"event_type": "trigger",
"incident_key": "245103 - 72",
"description": "MyMonitor at location Boston, MA",
"client": "AlertSite Monitoring Service",
"client_url": "https://www.alertsite.com/login",
"details": {
"location_num": "72",
"http_status": "HTTP/1.1 200 OK",
"location": "Boston, MA",
"status": "5",
"custid": "C77767",
"status_text": "Validation failed",
"errcount": "1",
"device_id": "245103",
"device_typecode": "w",
"device_name": "MyMonitor",
"device_type": "Web Server",
"timestamp": "2015-09-25 06:01:32",
"transaction": "0",
"company": "SmartBear"
}
}
Example of an “all clear” notification (sent when an availability problem is fixed):
{
"client": " AlertSite Monitoring Service"
"client_url": " https://www.alertsite.com/login"
"description": "Already fixed the issue with MyMonitor at location Boston, MA",
"details": {
"fixed at": " 2015-10-16 15:17:01"
}
"event_type": " resolve",
"incident_key": " 125011 - 20",
"service_key": "https://52.23.239.237:8089"
}
Example of a performance alert:
{
"service_key": "https://splunk.myserver.com:8089/",
"event_type": "trigger",
"incident_key": "MyMonitor - Performance",
"description": "MyMonitor",
"client": "AlertSite Monitoring Service",
"client_url": "https://www.alertsite.com/login",
"details": {
"notify_type": "perf_error",
"locations": [
{
"perf_actual": "3.503",
"perf_location_num": "5130",
"perf_location": "London, UK - Docklands",
"perf_threshold": "3.500",
"perf_status": "20"
},
{
"perf_actual": "2.361",
"perf_location_num": "19",
"perf_location": "Miami, Florida",
"perf_threshold": "2.000",
"perf_status": "10"
}
],
"status": "20",
"custid": "C14553",
"device_id": "271069",
"device_name": "MyMonitor",
"timestamp": "2015-10-05 12:41:50",
"company": "SmartBear",
"perf_count": 2
}
}

 Create a user via Splunk web interface