LoadComplete collects exhaustive information for each load test run. This topic describes the collected results and explains how to work with them.
About Test Results
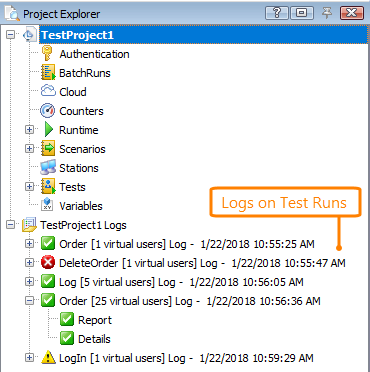
LoadComplete generates full-detailed results for each load test run. By default, LoadComplete automatically saves the results and shows them after the test run is over:
In LoadComplete, we call results test log.
LoadComplete project shows the test results in the Project Explorer under the Project_Name Logs node:

By default, LoadComplete stores test logs for all the test runs. When a test log becomes obsolete or no longer needed, you can delete it from the project (see Adding and Deleting Log Files).
You can limit the number of test logs that LoadComplete will store using the Number of recent logs to keep option. LoadComplete will automatically delete older test logs as newer logs are generated.
You also can disable test logs. LoadComplete will not store test results or will store them only if any warning or error occurs during the test run.
To view a result item, simply double-click it in the Project Explorer panel or right-click the target item and choose Open from the context menu.
Test Log Panels
LoadComplete displays results in several panels:
-
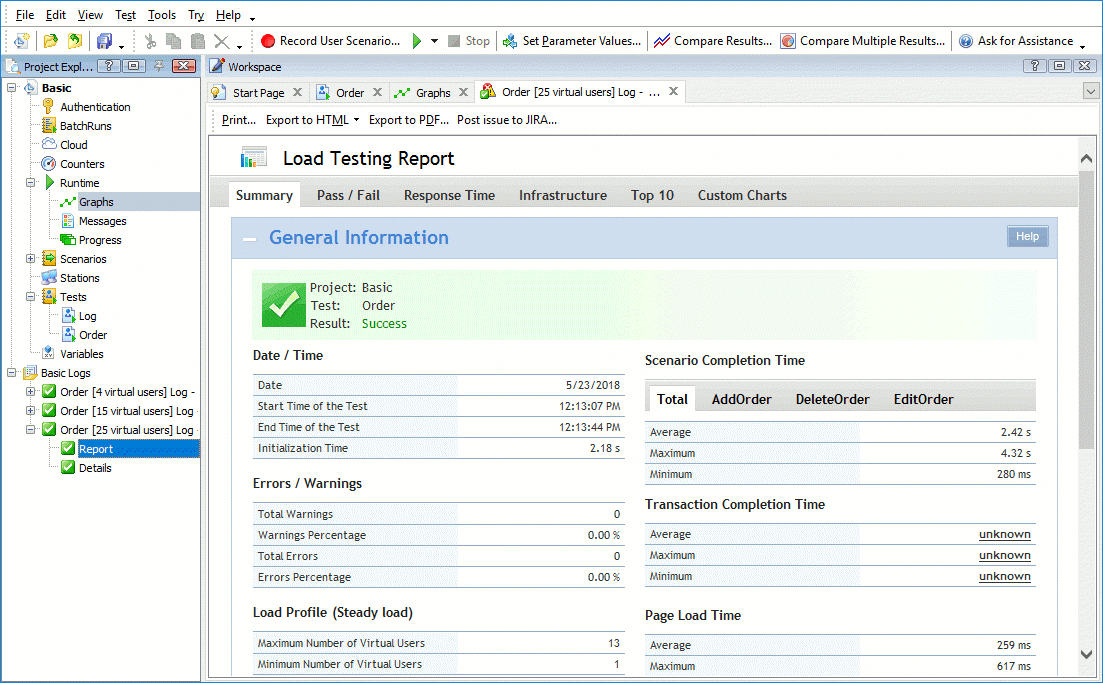
Report panel – shows the test run report that includes graphs and charts representing the test run statistics. For instance, it contains high-level information, such as the test name, the workload profile, the total number of simulated requests and so on. The panel also contains a graph for each test run metric (time to the first byte, time to the last byte, page load time and so on). For convenience, the graphs are organized into several tabbed pages according to the metric they represent.
-
Details panel – shows information on the requests sent to the tested web server during the test run. If LoadComplete was unable to simulate a connection or request, the test log will contain errors or warnings.
When you select a request in the Details panel, LoadComplete shows additional information on the request in the following sub-panels:
-
The Request Header and Response Header panels show the expected and actual contents of the request’s and response’s headers.
-
The Request Body panel shows the contents of POST requests sent to the server.
-
The Response Body shows the contents of the response body received from the server.
-
Analyzing Test Results
-
To start analyzing the results, open the Report panel’s Summary page. It contains information on whether the test run has passed, or whether errors or warnings occurred. It also contains brief information on the test run: its duration, the number of simulated virtual users, the average page load time, the response transfer time and so on.
-
To get detailed information on the performance of the tested web server, view the corresponding pages of the Report panel:
-
To learn the results of loading pages and page resources, view the graphs and charts on the Pass/Fail page.
-
To learn how the load testing metrics change during the test run, view the graphs on the Response Time page.
-
To learn how the request transfer time and response transfer time metrics change during the test run, view the graphs on the Infrastructure page.
-
To learn which pages and page resources took most of the time to load, view the charts on the Top 10 page.
-
-
To find the cause of errors and warnings that occurred during the test run, explore the contents of the Details panel. The panel contains all the requests sent by all virtual users during the test run. The values in the Status column indicate whether a request was simulated successfully:
-
LoadComplete considers requests successful if the status code obtained during the simulation matches the recorded status code. In this case, the column shows the
 icon.
icon. -
If a request was simulated, but the server returned a response code that differs from the expected one, the test engine reports a warning and the column shows the
 icon.
icon. -
If a request failed, for example, an error occurred on the server, the test engine reports an error and the column shows the
 icon.
icon.Note: You can configure how LoadComplete will treat a status code in a custom way. To do this, add the obtained status code to the Expected HTTP Responses list of the Scenario editor. -
If you specify service level agreement criteria for the entire test or individual requests, pages or other operations in your scenarios, the test log may report that the criteria were violated. This does not mean that the test failed. This indicates that the tested server performance did not comply with the criteria.
You can filter test results in the Details panel to find the needed data more quickly. For example, you can view only failed connections and requests or those requests that a certain virtual user simulated. See Filtering Results Data.
For information on troubleshooting errors and warnings, see Resolving Errors and Warnings.
-
Configuring the LoadComplete Log
You can configure the way LoadComplete will generate and show test results in the following dialogs:
-
In the Simulating - General Options dialog, specify whether LoadComplete will gather simulation data during test runs and what request and response information it will include.
Note: The options you configure in this dialog do not affect the scenario verification. They affect only test runs. -
In the Log Options dialog, specify how LoadComplete will show test results after the test run and how many recent logs it will keep.
The log options are common for all LoadComplete projects.
Compatibility Issues
Since version 4.70, LoadComplete does not support test logs created in LoadComplete versions 4.0 - 4.61, version 3.x and in LoadUIWeb. Those test logs will be unavailable.
However, you can open projects created in earlier LoadComplete versions and in LoadUIWeb 2.99 and work with them. See Migrating Projects to LoadComplete 4.

 About Test Results