
The General Information section of the Report panel shows a brief summary of the test run, such as the test date/time, duration and result, the workload profile and the use of the Continuous Load feature, the number of virtual users simulated, the range and average page load time, time to first byte and time to last byte values, and so on.
Viewing the Section
To open the General Information section —
-
Open the desired Report item (if it is not open yet). To do that, double-click the log’s Report node under the Project_Name Logs folder in the Project Explorer panel.
-
In the Report panel, select the Summary tab and expand the General Information section.
Description
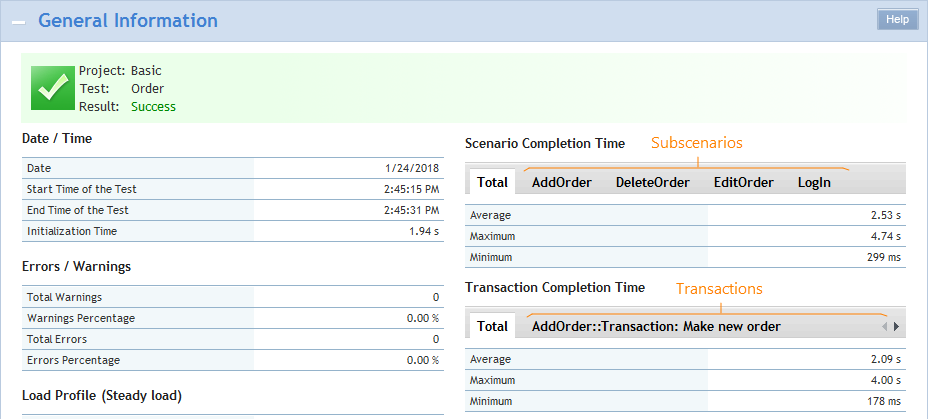
A sample view of the General Information section is as follows:
If the simulated scenarios include subscenarios, the Scenario Completion Time section displays the results of these subscenarios. Similarly, if the scenarios contain multiple user-defined transactions, the Transaction Completion Time section will display the results of each transaction:
Information is divided into several tables.
Date / Time table
The Date / Time table contains the date, the start time, the end time and the initialization time of the test run.
| Note: | Date/time values displayed in this section are displayed depending on the time zone settings that are currently set on the given machine. If you change the time zone settings, values displayed in the column change as well. |
Errors / Warnings table
The Errors / Warnings table contains the number of errors and warnings occurred during the test run:
-
Total Warnings and Total Errors show the total number of errors and warnings occurred during the test run. You can click the view link to open the Detailed test log to view information on those errors and warnings.
-
Warnings Percentage and Errors Percentage show the percentage of warnings and errors to all simulated operations.
Notes:
-
The Total Errors and Total Warnings values may differ from the number of requests simulated with errors and warnings. This can happen because:
-
The test engine can post several errors or warnings per request. For the same reason, the Warnings Percentage and Errors Percentage values may be above 100%.
-
The results can include custom errors and warnings posted by the Custom Message operation.
-
-
If your test log was generated in LoadComplete 4.70, the Warnings Percentage and Errors Percentage values will be “unknown”.
Load Profile table
The header of the Load Profile table displays the load profile (like steady load, stepwise or custom shape).
The table shows —
-
The minimum and maximum number of virtual users simulated during the test run.
Note: You can also see the number of virtual users over time in the Load Profile graph further down in the report. -
The test duration.
-
The number of scenarios run.
-
The number of transactions performed.
-
The number of web pages opened.
-
The number of requests sent.
-
The 90 percent response time, 95 percent response time, 98 percent response time, 99 percent response time. It is a response time value that covers 90%, 95%, 98% or 99% of requests in the test respectively.
-
Standard deviation. This value shows the deviation of the measured response time values from the average response time value.
| Note: | LoadComplete analyzes the percent response time values only if there is at least one successful request in the run. Otherwise, the section shows that the value is “unknown”. |
Scenario Completion Time table
The Scenario Completion Time table contains the minimum, maximum and average completion times measured for scenarios during the test run. For detailed statistics, see the Scenario Completion Time graph on the Response Time tab.
If the simulated scenarios include subscenarios, the Scenario Completion Time section will display the completion time for each of them (see above). The Total tab contains results for the simulated “parent“ scenario.
| Note: | If none of the scenarios has been simulated completely, the section shows “unknown”. See Why LoadComplete Reports Unknown Time. |
Transaction Completion Time table
The Transaction Completion Time table shows the minimum, maximum and average transaction completion time measured for user-defined transactions during the test run. For detailed statistics, see the Transaction Completion Time graph on the Response Time tab.
If the simulated scenarios include multiple transactions, the Transaction Completion Time section will display the execution time of each transaction (see above). The Total tab will contain combined results: the minimum, maximum and average completion time of all the transactions simulated during the scenario execution.
| Note: | If a scenario has no transactions defined, or none of the simulated transactions has passed, the section shows “unknown”. See Why LoadComplete Reports Unknown Time. |
Page Load Time table
The Page Load Time table shows the minimum, maximum and average time of loading a web page during the test run.
| Note: | To calculate these values, LoadComplete uses only those pages where all the requests passed. If a page has at least one failed or incomplete request, it is excluded from calculation. If each simulated page has incomplete or failed requests, LoadComplete reports ”unknown“ load time in this section. |
You can see detailed load time statistics in the Page Load Time graph on the Response Time tab.
Time to First Byte table
The Time to First Byte table contains the minimum, maximum and average times to first byte measured for the passed requests during the test run. For detailed statistics, see the Time to First Byte graph on the Response Time tab.
| Note: | If none of the simulated requests has passed, the section “unknown”. See Why LoadComplete Reports Unknown Time. |
Time to Last Byte table
The Time to Last Byte table contains the minimum, maximum and average times to last byte measured for the passed requests during the test run. For detailed statistics, see the Time to Last Byte graph on the Response Time tab.
| Note: | If none of the simulated requests has passed, the section “unknown”. See Why LoadComplete Reports Unknown Time. |
For more information on the graphs and tables shown in the Report panel, see About Report Panel.
See Also
Summary Page of the Report Panel
Report Panel
About Test Results
How LoadComplete Calculates Metric Values
Test Result Panels
Creating and Configuring Load Tests