About the Details Panel
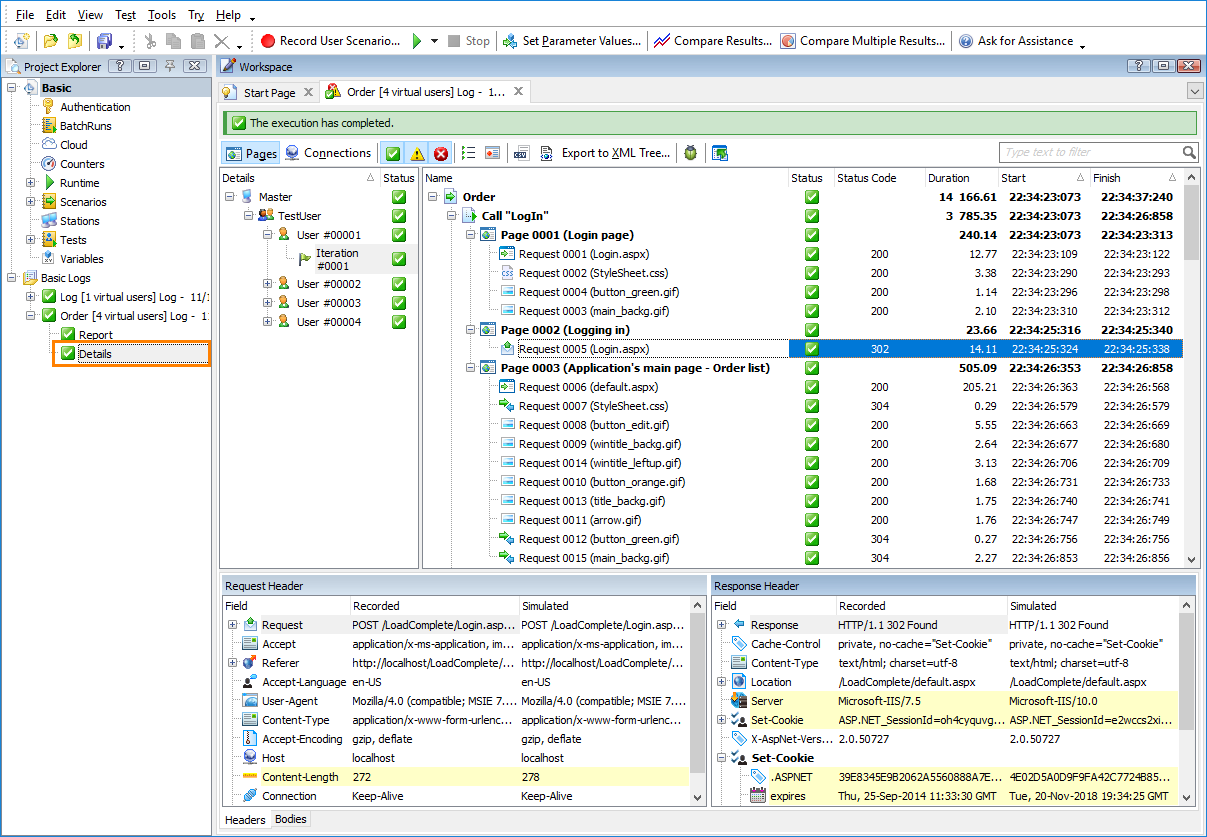
The Details panel shows information on scenario operations simulated during the test run. For instance, it shows information on simulated requests and responses received from the server.
Below is a sample view of the panel:
Opening the Panel
Requirements
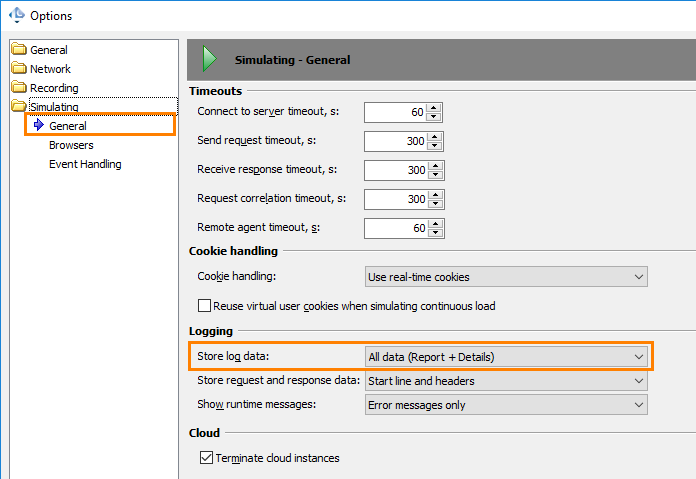
To view the Details test log, configure LoadComplete to collect detailed data on simulated operations before running your load test. To do this, set the Tools > Options > Simulating > General > Store log data option to All data (Report + Details), or to Report data + Details for unsuccessful VU iterations. In the latter case, the Details test log will be available only if virtual user simulation failed during the test run.
 Collecting detailed data on simulated operations when running large load tests with multiple virtual users can affect the test performance.
Information on the Panel
The Details panel shows a list of operations simulated during the test run.
At the top of the panel, you can see the simulation status: whether the scenario or test execution was completed, terminated unexpectedly or stopped by the user.
In the left part of the panel, there is a tree containing the simulated virtual users. The virtual users are organized by the workstations where they were simulated and by groups to which they belong. Each virtual user can have one or several iterations.
| Column name | Description |
|---|---|
| Details | A simulated iteration, virtual user, group of virtual users, or a workstation on which the virtual users were simulated. |
| Status | Indicates how the current virtual user iteration, all virtual user iterations, all virtual users in the current virtual user groups or on the workstation were simulated:
|
In the right part of the panel, there is a list of scenario operations simulated during the selected virtual user iteration. You can group the operations by the pages and connections to which they belong.
| Column name | Description |
|---|---|
| Name | An operation simulated during the test run. It can be an HTTP request or a WebSocket message, Connection, Page, Transaction, Scenario operation or operation that controls the traffic flow (for example, Call Scenario, While, Loop and so on). To learn more about operations, see Operation Reference. The column also contains additional information on the selected operation. For example, for a request simulated with an error, the column may show information on the cause of the error, whereas for the End of Transaction operation, the column shows the duration of the respective user-defined transaction. |
| Type |
The type of the operation selected in the Name column. |
| Status |
The status of the operation simulation.
For HTTP requests, it corresponds to the status code received from the server:
For custom messages, it corresponds to the message type. |
| Status Code | The status code of the simulated operations. For HTTP requests, it is the status code of the response received from the server. |
| Duration | The time it took to simulate the item (in milliseconds):
|
| Start | The time when the operation simulation started.
|
| Finish | The time when the operation simulation was finished.
|
| Request time | The time it took LoadComplete to send the request. |
| Response time | The time it took LoadComplete to receive and process a response to the request. |
| Response Body Size | The amount of data (in bytes) received from the server in the response body. |
| Think time | The time (in milliseconds) between the current and the subsequent request, connection or page. |
Request and Response Headers and Bodies
The Details panel also contains several subpanels that show additional information on the simulated requests:
More Information on Test Results
|
To learn more about … |
See these topics … |
|---|---|
|
Resolving errors and warnings |
|
|
Analyzing test results |
|
|
Setting expected response codes directly from the test log |
|
|
Filtering requests in the test log |
|
|
The panel’s context menu |
|
|
The panel’s toolbar |


 OK - All the operations in all the scenarios were simulated successfully.
 Error - The iteration, virtual user or workstation has an operation simulated with an error.
 Warning - The iteration, virtual user or workstation has an operation simulated with a warning.