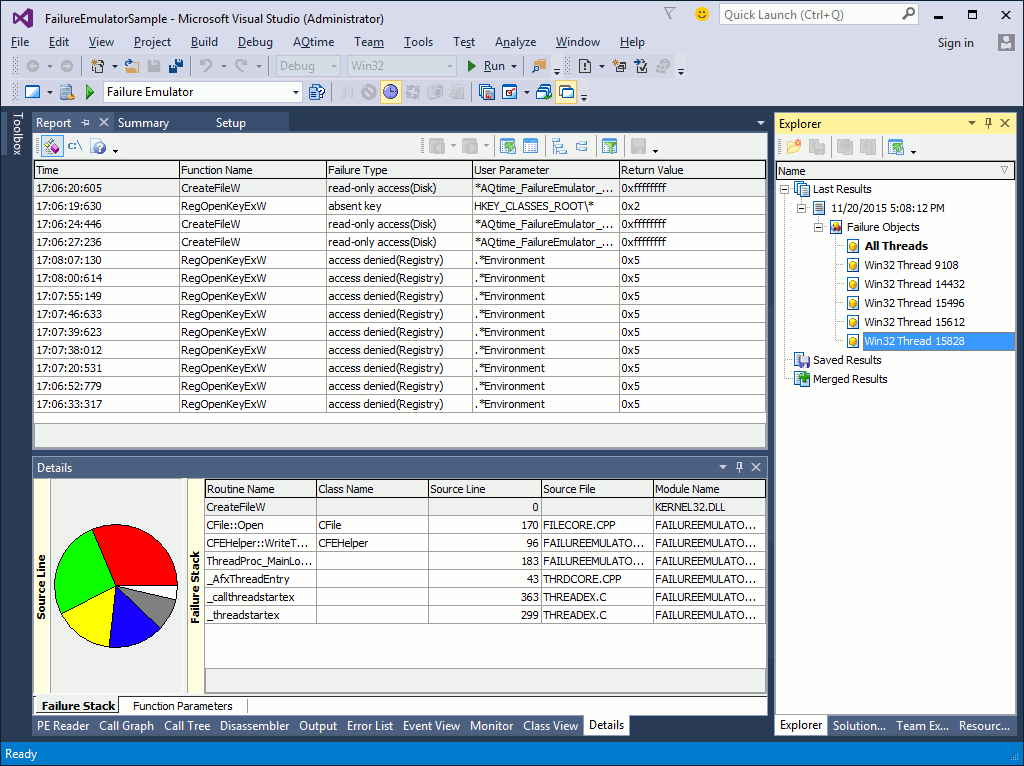
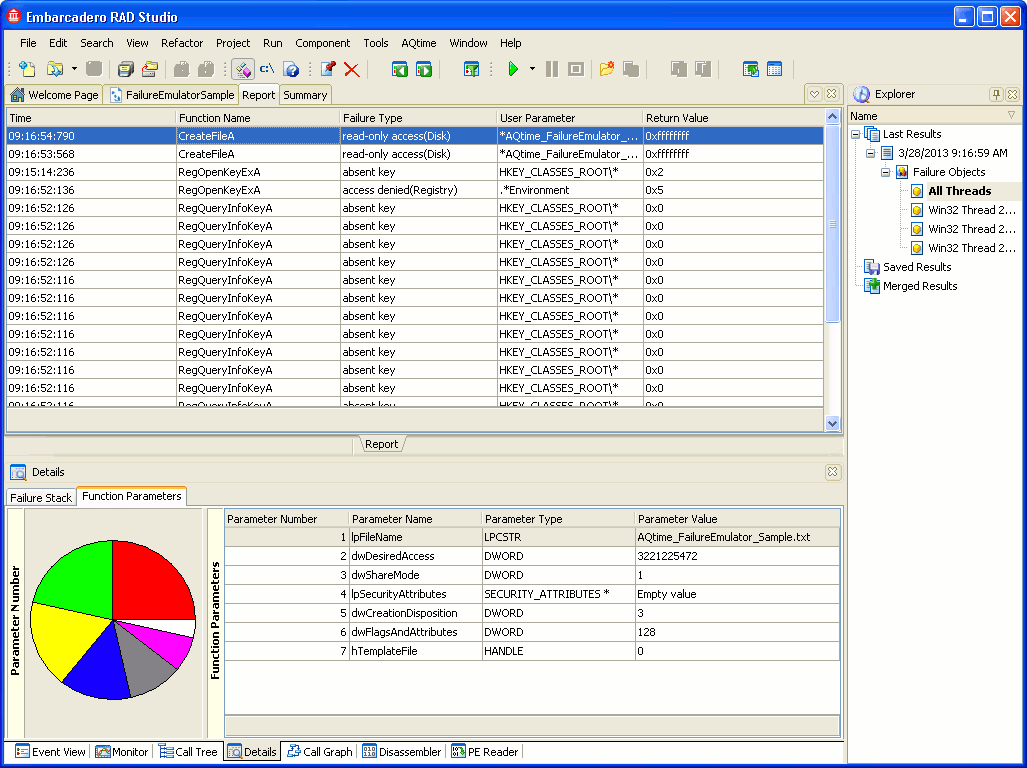
When your application is running under the Failure Emulator profiler, AQTime makes the application think that some unexpected conditions are met. This allows you to check whether these conditions make your application fail or the application code handles such situations correctly and prevents failures.
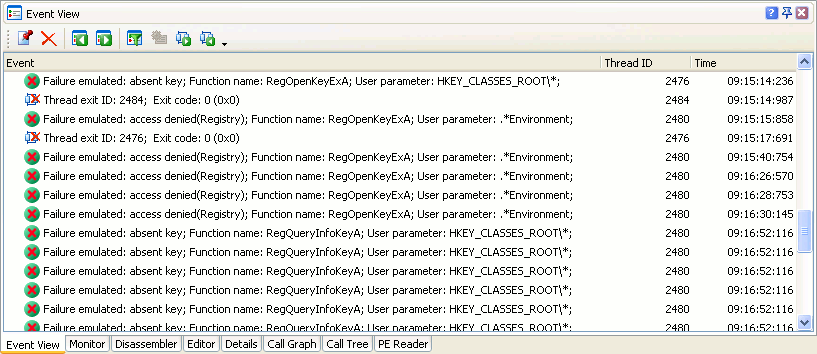
Every time the profiler emulates a failure, it posts it to the Event View panel. You can use the panel to track emulated failures:
Like other AQTime profilers, Failure Emulator generates results upon selecting Run > Get Results from AQTime’s main menu,selecting AQTime > Get Results from Visual Studio’s main menu,selecting AQTime > Get Results from RAD Studio’s main menu or after the application terminates. The Failure Emulator profiler results are displayed as subnodes of the Failure Objects result set node in the Explorer panel. The following sections provide a brief overview of results and panels that hold them and describes how to analyze the results and search for failures.
Viewing Summary Profiling Results
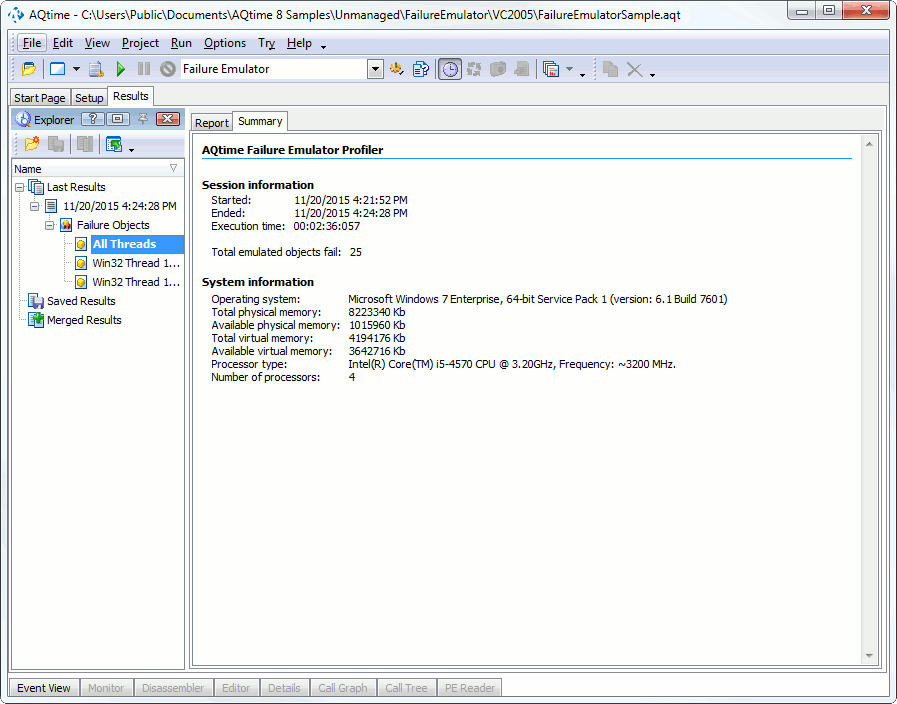
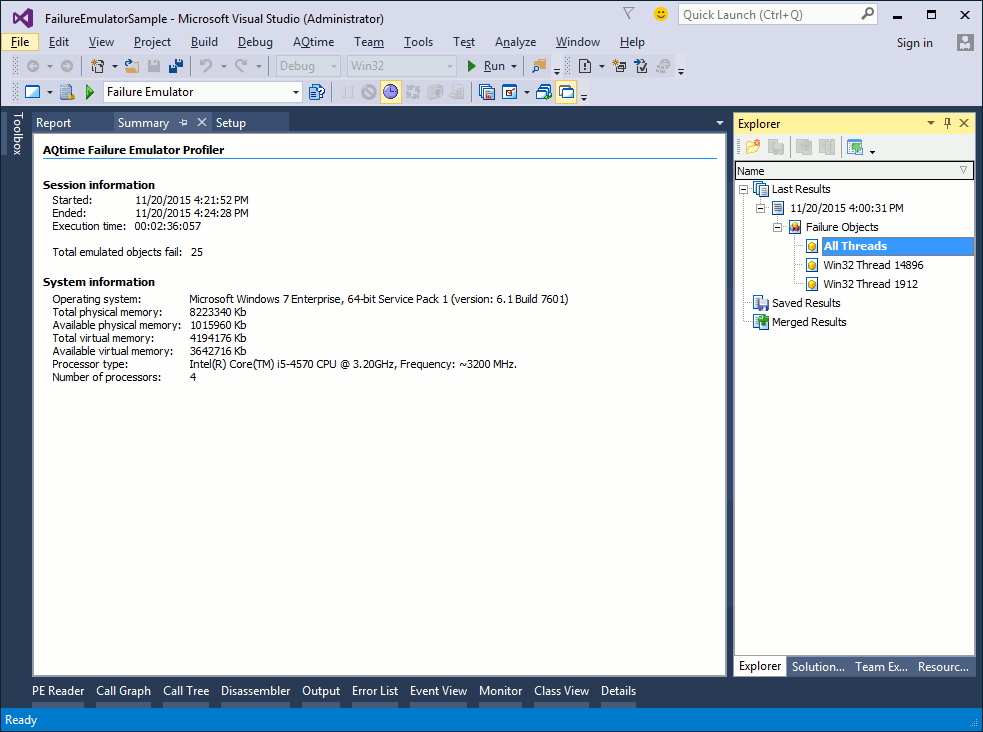
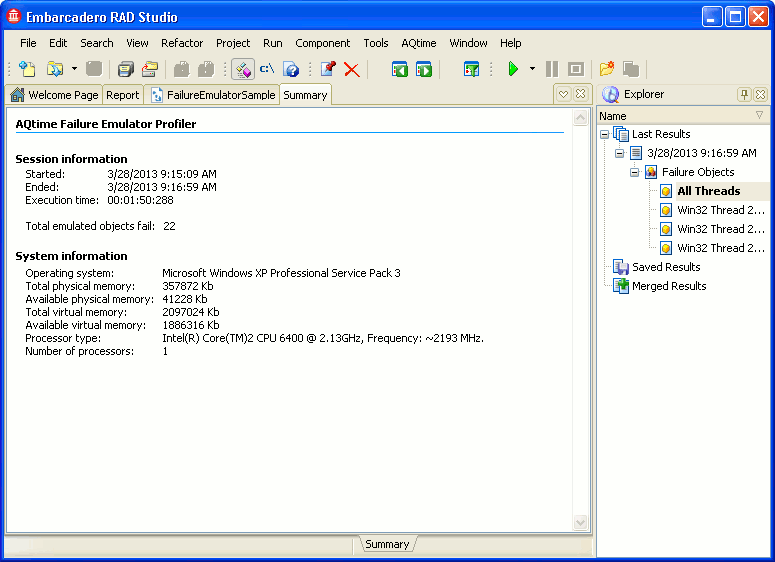
The Summary panel displays brief profiling results that contain the number of emulated failures and information on the profiling session, operating system and so on:
Viewing Detailed Information
Detailed information on emulated failures is displayed in the Report and Details panels.
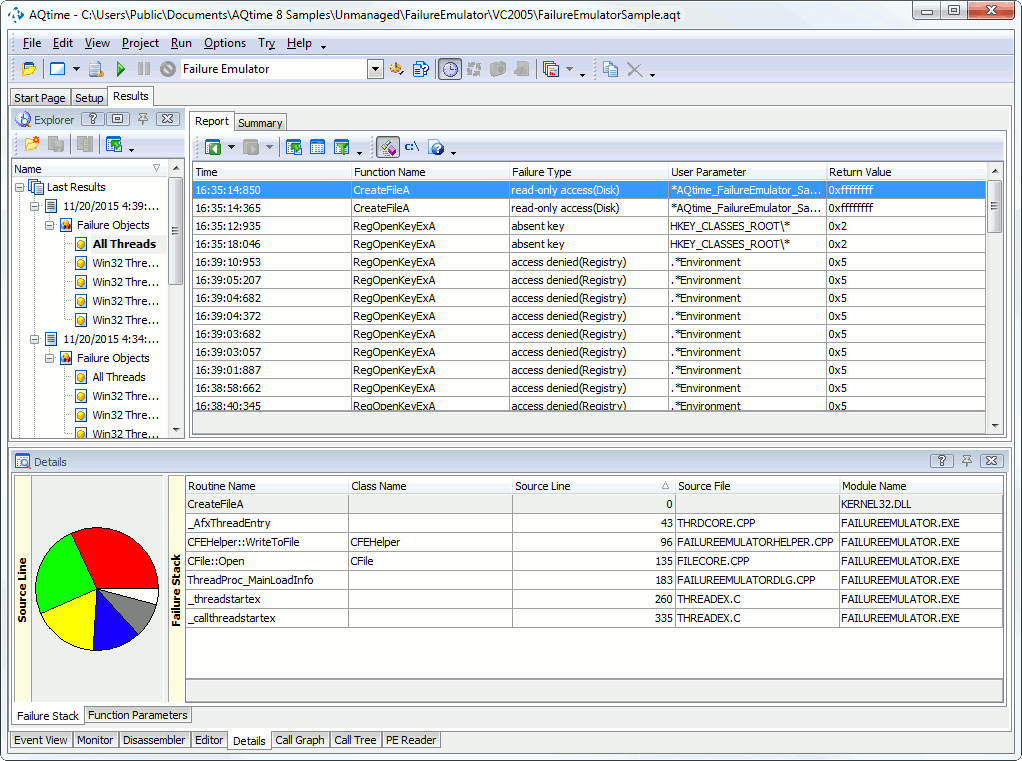
All failures simulated during the profiling session are shown in the Report panel. Here is a sample output of the Failure Emulator profiler:
Each row in the Report panel corresponds to an emulated failure. Columns of the Report panel provide information on each failure:
-
The Failure Type column shows the type of the emulated failure. For the full list of all available failure types, see Failure Emulation Reference.
-
The User Parameter column shows parameters specified for the emulated failure.
-
The Function Name column shows the name of the system function to which the profiler emulated an erroneous call.
For the full list of available columns, refer to Failure Emulator Profiler - Report Panel. You can remove, add and arrange columns in the panel. For more information, see Adding and Removing Columns and Arranging Columns, Lines and Panels.
Searching for Failed Routines
To find a routine that failed in your application, select the desired failure in the Report panel and switch to the Details panel.
The panel contains two tabs that display information on the system function that failed due to selected failure (the name of the system function is shown in the Function Name column of the Report panel):
-
The Failure Stack tab shows the call stack that led to the system function call:
The topmost routine in the stack is the system function to which the profiler emulated the erroneous call.
-
The Function Parameters tab contains information on parameters of the selected system function.
To find out which function in your application failed under emulated conditions, explore the call stack shown in the Failure Stack tab of the Details panel:
-
Go through the rows of the table from top to bottom.
-
Find the first routine in the stack that belongs to your application - the file specified in the Source File column must contain your application source code.
-
If the profiling information is collected by routines, the Source Line column specifies the number of the source code line where the routine implementation begins. If the profiling information is collected by lines, the column specifies the number of the source code line where the failure occurred.
Exploring the Application Code
To view the code of the desired routine, double-click the appropriate line in the Details panel. AQTime moves the cursor in the Editor panel to the source code line for the compliance routine (the path to source files must be specified in the Project Search Directories and Search Directories dialogs). The cursor in the page that contains the source code will move to the source code line for the compliance routine. The cursor in the page that contains the source code will move to the source code line for the compliance routine.
Using this feature, you can quickly find the line of the code that caused the simulated failure and then update the application’s code, so it can prevent such failures in the future.
See Also
Failure Emulator Profiler Results
Failure Emulator Profiler
Failure Emulator Profiler - Overview
Add New Failure Emulation Wizard

 Viewing Summary Profiling Results