Along with other profilers, AQTime offers you the Failure Emulator profiler that allows emulating various conditions that may cause failures in your application. This profiler is really helpful when you need to check whether your application has code that prevents it from unexpected failures.
Sections of this topic provide an overview of the Failure Emulator profiler.
Testing Applications Under Unexpected Conditions
The Failure Emulator profiler emulates erroneous calls to Windows API and memory management functions made from your application code allowing you to check whether your application handles these errors properly, that is, whether your application has code that prevents failures. For example, you can check whether the application that has the .txt file as an input parameter behaves correctly (shows an informative message or something else) when you try to open a file you do not have permissions to open. If the code contains needed lines, the application will not fail. Otherwise, the conditions for the application failure are met and you may see how your application behaves in an unexpected situation.
This approach is very useful when you need to test your application with unsupported and unexpected values. AQTime offers you various types of failures that can be emulated using the tool. For example, you can emulate the situation when a COM server is absent and then try to connect to this server from your application. The main advantage of this profiler is that you do not have to do anything with the server. AQTime will make your application “think” that the server is absent.
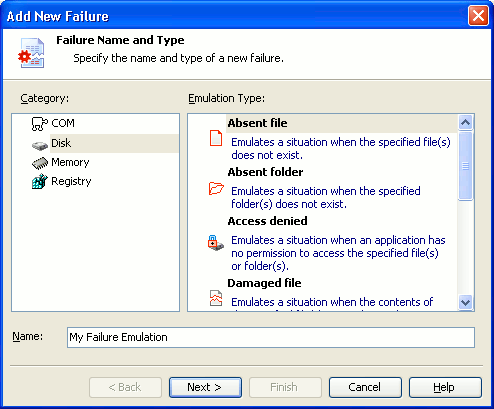
The desired failure types are specified for the application before you start profiling. For this purpose, AQTime provides you with the Add New Failure Emulation wizard that assists you in specifying failures to be emulated and parameters for these failures:

Available Failure Types
AQTime lets you emulate the following types of application failures:
-
Failures related to the COM technology. This type allows emulating different failures related to COM servers. For example, you can emulate a situation when the application tries to interact with an unregistered or absent COM server.
-
Failures related to files and folders access. This type allows emulating application failures related to accessing different files, folders or disks of your computer. For example, you can use failures of this type to emulate the situation when your application tries to connect to a damaged or nonexistent file or when it tries to write information to a read-only file or a full disk.
-
Failures related to memory allocations. This type allows emulating application failures related to the shortage of memory available for the application run. For example, you can use such failures to emulate the situation when there is no enough heap or virtual memory for the application.
Note: The profiler emulates failures related to memory allocation only when profiling unmanaged (native-code) applications. Emulation of memory failures when profiling managed (.NET) applications is not supported. -
Failures related to registry mistakes. This type allows emulating application failures related to working with registry keys and values. For example, you can emulate the situation when your application tries to access an absent key or value or when the application tries to write data to a read-only key for which you have no access permission.
For detailed information on available failure emulation types and their parameters, see Failure Emulation Reference. For information on how to add a failure to the list of emulated failures, see Failure Emulator Profiler - Setting Up Emulated Failures.
How to Profile With Failure Emulator
The general procedure of using the Failure Emulator profiler includes the following steps:
-
Choose code to be included in the call stack. The Failure Emulator profiler collects call stack information on functions that fail under emulated conditions. To control which modules are to be included in the stack, on the Collect Stack Information pane, add the desired modules to stack areas. For more information, see Specifying Modules to Be Included Into the Call Stack.
-
Set up emulated failures. To set up failures to be emulated during the profiling, use the Add New Failure Emulation wizard. You can call the wizard either from the Profiler Options dialog right before the profiler run or from the Failure Emulator Options dialog at design time. For step-by-step instructions on choosing the failure to be emulated, see Failure Emulator Profiler - Setting Up Emulated Failures.
-
Profile the application. After all the preparations are made, you can start profiling the application, perform the actions that may cause the emulated failures and then close the application. After that, AQTime will generate results that let you analyze the application behavior under the emulated conditions.
Profiling Results
The main result of using the Failure Emulator profiler is the behavior of the application under emulated failure conditions. In other words, it is a “reply” of your application to these conditions. For example, it can be informative or warning messages or some other events preventing your application from failing.
Every time the profiler emulates a failure, AQTime generates the Failure Emulated event and posts it to the Event View panel. So, you can track emulated failures using this panel.
After the profiling is over, you can also check results in the Report and Details panels. These panels contain information about the profiling process and provide you with brief information on emulated failures. For more information, see Failure Emulator Profiler Results.
See Also
Failure Emulator Profiler
Profilers Reference
Add New Failure Emulation Wizard

 Testing Applications Under Unexpected Conditions