Use the SLA Summary dashboard to create, configure, and review service level agreements (SLA) for your monitors. Here you can see whether a monitor met its SLA objectives for availability, uptime, and response time over the selected period.
To open the SLA Summary, select SLAs > Summary from the top menu. From there, select the desired SLA and time frame (24 hours, 7 days, 30 days).
How to Read the Dashboard
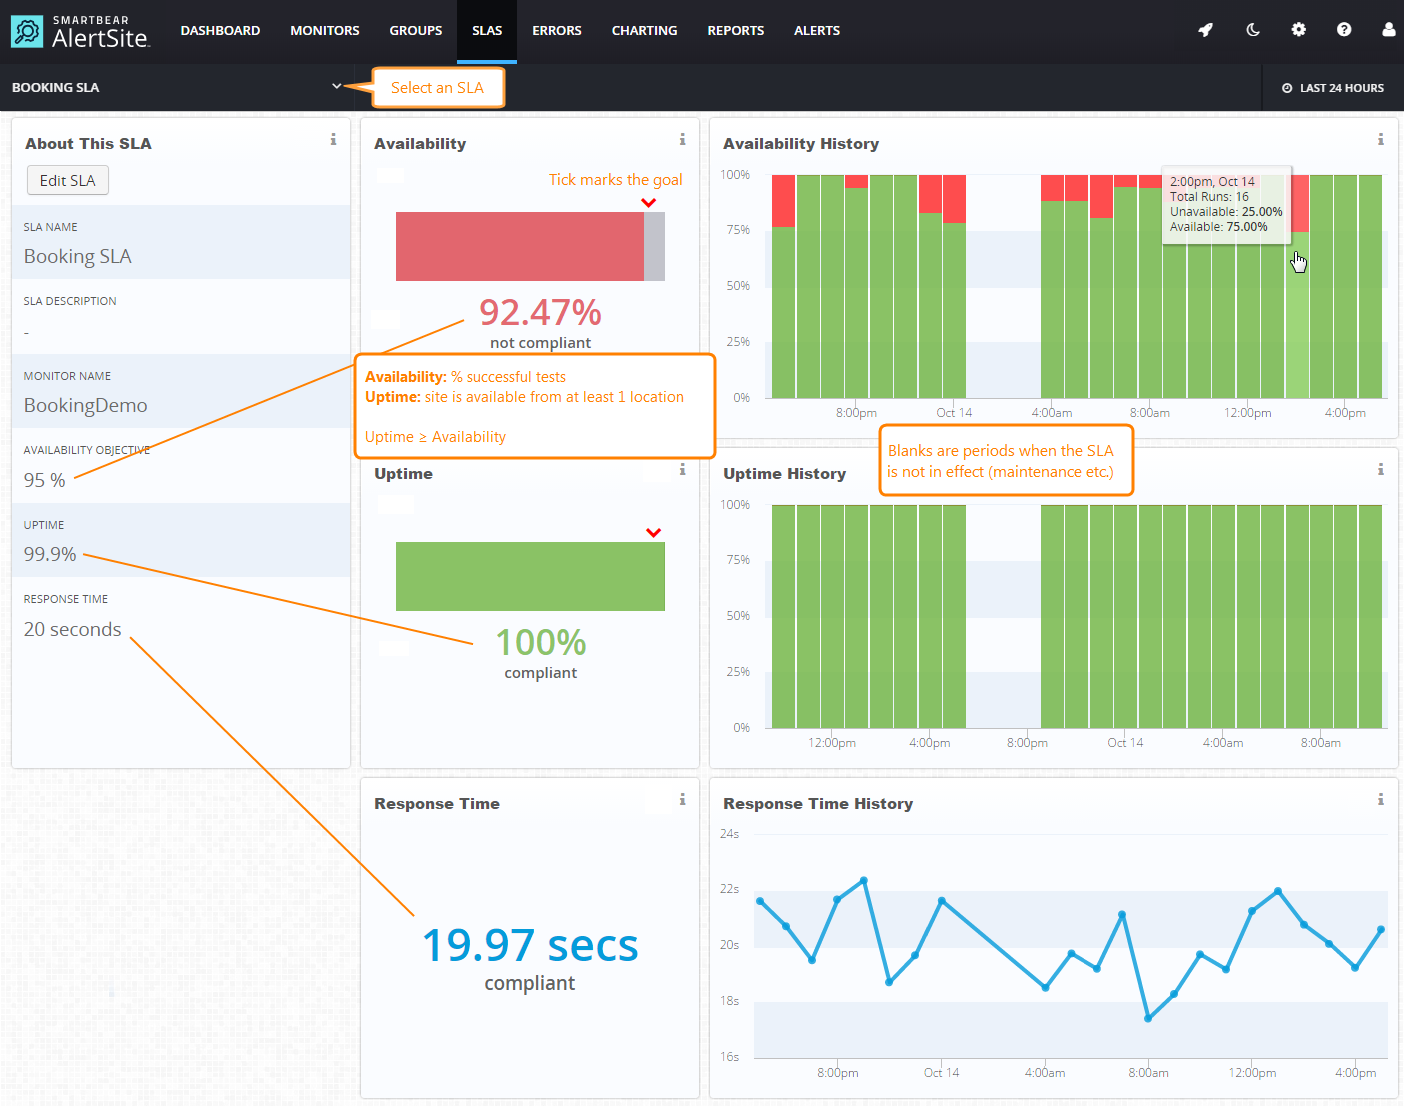
The left side shows the monitor that the SLA is assigned to and the SLA objectives:
-
Availability – Percentage of successful tests.
-
Uptime – Site is up if at least one location ran a successful test during the measurement interval, and down if all locations reported errors. Uptime information is available only for monitors with the SLA (MultiPOP) monitoring mode.
-
Response time – Maximum allowable response time. For multi-step monitors, this time includes all test steps. Website and real-browser (DéjàClick) monitors with the fullpage monitoring can use either the basic response time or full page response time as the SLA objective.
Response time objectives are also used as the Apdex thresholds.
Values in the middle are your actual averages for the selected period (24 hours, 7 days or 30 days), excluding non-SLA periods if any. Availability and uptime averages are displayed in green if they comply with the SLA, otherwise they are displayed in red. The ✔ tick marks the SLA objectives on a scale.
The charts on the right show the detailed availability, uptime and response time over time. The charts show only periods when the SLA is in effect, so there may be blanks. Basically, the charts are the same as in the Monitor Summary, but excluding non-SLA periods if any.
View Out-of-Compliance Events
The SLA Summary dashboard shows the averages over the reporting period to measure your overall SLA compliance. To review specific errors or times when your response time was higher than the SLA goal, you can use the Monitor Summary and Monitor Runs dashboards.
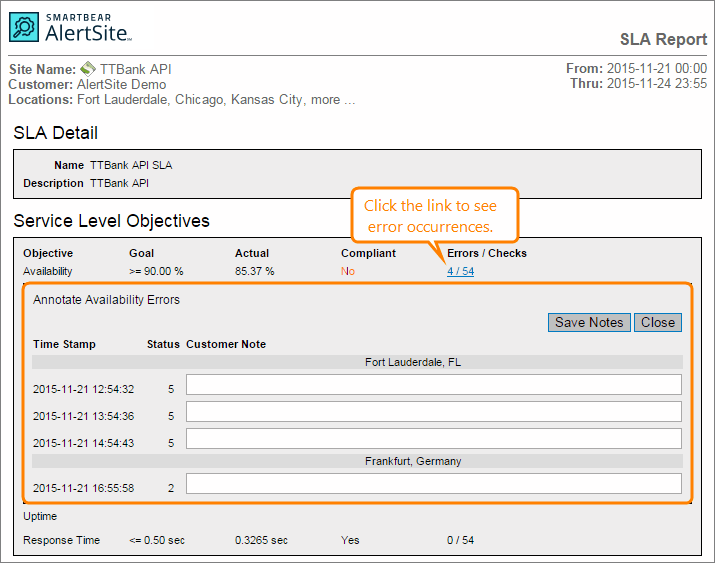
Another way is to create the SLA Detail report in Reports > Performance Reports. In the report, click the links in the Errors / Checks column to see a list of availability errors occurred. You can see the error date and time, status code and add your comments.
Create and Edit SLAs
On this dashboard you can create and edit service level agreements, if you are an Admin, Co-Admin or Power User.
Create a new SLA
-
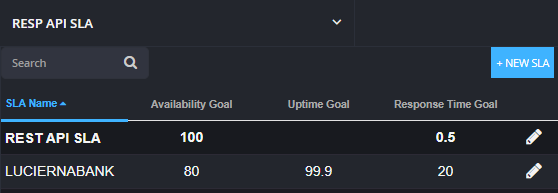
Open the list of SLAs and click New SLA.
-
Select the monitor for which you want to configure service level objectives and click Next.
-
Specify the objectives for availability, uptime, and response time and click Finish.
For a step-by-step guide, see Create a Service Level Agreement.
View existing SLAs
The drop-down list in the top left contains all your SLAs and their objectives. Select an SLA to show it on the dashboard.
Edit SLA
To edit the SLA objectives for availability, uptime and response time, click Edit SLA.
To edit SLA operating periods, go to SLAs > Op Periods/Exclusions and proceed from there. For details, see SLA Operating Periods and Exclusions.
After you change the SLA configuration, the SLA compliance is recalculated based on the new goals.
Delete SLA
Click Edit SLA, then click Delete, and confirm the deletion.
See Also
About Service Level Agreements
Create a Service Level Agreement (SLA)
SLA Operating Periods and Exclusions
SLA Summary Report
SLA Detail Report


