
This report is for monitors that have Service Level Agreement (SLA) objectives configured for availability, uptime, and response time. It compares the actual website performance with these objectives. The report includes only data collected during SLA operating periods to account for maintenance downtime and other factors.

Click the image to enlarge it.
Create the report
AlertSite UXM
-
Go to Reports > Performance Reports.
-
Select the SLA Detail report.
-
Select an SLA. Each SLA corresponds to a specific monitor.
-
Select one, several or all locations. AlertSite will calculate SLA compliance using results from these locations only.
-
Select the report period. You can use a relative period such as This Month or an exact period up to 3 months.
-
(Optional.) Use the Enhanced Time Controls filter to include or exclude data for specific days of the week or for specific time of the day.
-
Click Run Report.
AlertSite 1.0
-
Go to Reports > Performance Reports.
-
Select a monitor with an SLA.
-
Select the SLA Detail report.
-
Select one, several or all locations. AlertSite will calculate SLA compliance using results from these locations only.
-
Select the date range. You can use a relative period such as This Month or an exact period up to 3 months.
-
(Optional.) Set the Time Filter to include or exclude data for specific days of the week or for specific time of the day.
-
Click Create Report.
Once the report is ready, you can view, email or schedule it. For details, see Scheduling Reports.
Report data
The report shows your SLA objectives for availability, uptime, and response time, and the actual results from your site. Actual results are calculated based on data from the SLA operating periods (default is 24×7, but you can change it in SLAs > Op. Periods / Exclusions).
Service level objectives
Service level objectives are defined as follows:
-
Availability – Percentage of successful tests out of all tests.
-
Uptime – Percentage of time when the site was accessible from at least one location. This is not the same as availability – a site can be up, but not available in some locations because of a network outage. Uptime metric is available only for monitors with the SLA (MultiPOP) monitoring mode and 2 or more locations.
-
Response time – Average response time, in seconds, over the reporting period.
For more information about these metrics, see About Service Level Agreements.
Time filter
This section appears if the report was created with the Enhanced Time Controls filter enabled. It shows the days of the week and the time of the day included in or excluded from the report.
 View image

Report API
You can get the report data in XML format using AlertSiteReport API. For example, the following link generates a report for customer ID C12345, monitor ID 130705, from Charlotte, Boston, and Austin locations (IDs 22, 63 and 72), for the last week. You can open this link in the browser, and the XML report data will be displayed.
https://www.alertsite.com/report-api/sla/C12345?&obj_device=130705&location=22,63,72&rdate=LastWeek
Make sure to replace the highlighted values with your actual values:
-
The customer ID is displayed on the > Settings > Account screen.
-
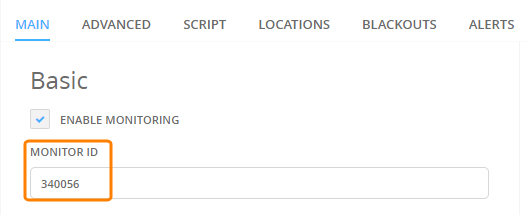
The monitor ID appears:
AlertSite UXM
-
In monitor settings:
-
In the table on the Monitors > Overview > Config screen.
AlertSite 1.0
-
In the browser address bar of the monitor configuration screen:

Click the image to enlarge it.
-
-
Locations IDs can be found here.
To download the report using cURL or similar tools, include your AlertSite login and password for authentication:
curl -o report.xml -u [email protected]:password "https://www.alertsite.com/report-api/sla/C12345?&obj_device=130705&location=20,30,40&rdate=LastWeek"
For more information and examples, see Get SLA Detail Report.
FAQ
SLA Detail report shows more Uptime checks than should be
Q: We are monitoring every 15 minutes, which means 4 checks per hour, 96 checks per day and 672 checks per week. But the weekly report shows 690 checks – more than it should be. Where do the extra checks come from?
A: SLA (MultiPOP) monitors run tests from multiple locations simultaneously at each interval. When using rotated locations, the default behavior when one of the locations cannot be reached is to repeat the test from other locations that can be reached – to fulfill the SLA requirement of a simultaneous test from N locations. This is what causes extra checks.
See Also
SLA Monitoring
SLA Summary Report
Report Types
Creating Reports