Apdex (Application Performance Index) is an industry standard to measure user satisfaction with a web application’s response time. Apdex ranges from 0 to 1, where 1 means all users are happy, and 0 means all users are frustrated. To learn more about Apdex, visit www.apdex.org.
Apdex is a combination of availability and performance metrics, where fast and error-free responses increase the score, and long responses and errors reduce the score. It is similar to Service Level Agreements (SLAs), but more tolerant of rare occasional delays.
Methodology
AlertSite rates all monitor runs as satisfied, tolerating or frustrated based on their run time – the total response time of all test steps.

The zones are defined by two thresholds, T (for tolerating) and F (for frustrating):
-
Satisfied – Run time is ≤T.
-
Tolerating – Run time is >T and ≤F.
-
Frustrating – Run time is more than F, or the run reported an error.
The thresholds T and F are set in the monitor’s SLA (Service Level Agreement). If F is not set, it defaults to 4T.
If the monitor does not have an SLA, T is 2 seconds per page, and F is 8 seconds per page (4×2 seconds). See Apdex Threshold below for details.
The Apdex score is the ratio of satisfied runs and half the tolerating runs to the total monitor runs. The formula includes tolerating runs, because users can often tolerate some delays.

To get the perfect Apdex of 1.00, all monitor runs should complete within the threshold time. Apdex below 0.50 is considered unacceptable, and 0.00 means all users are frustrated.
Example
A monitor ran 10 times: 7 satisfied, 2 tolerating and 1 frustrated.
Apdex = (7 + 2/2) / 10 = 0.80
Apdex for Monitor Groups
For a monitor group, the Apdex formula uses all runs of all monitors in that group. A group’s Apdex is not the average of each monitor’s Apdex.
Example
A group contains 2 monitors:
-
Monitor A: 4 runs, with 4 satisfied.
-
Monitor B: 6 runs, with 2 satisfied, 2 tolerating, and 2 frustrated.
This group has a total of 10 runs with 6 satisfied, 2 tolerating, 2 frustrated.
Apdex = (6 + (2/2)) / 10 = 0.70
Apdex Ratings
Based on the Apdex score, AlertSite assigns the performance rating to your monitors and monitor groups.
| Apdex Rating | Apdex |
|---|---|
| Excellent | 0.94–1.00 |
| Good | 0.85–0.93 |
| Fair | 0.70–0.84 |
| Poor | 0.50–0.69 |
| Unacceptable | 0.00–0.49 |
Apdex Thresholds
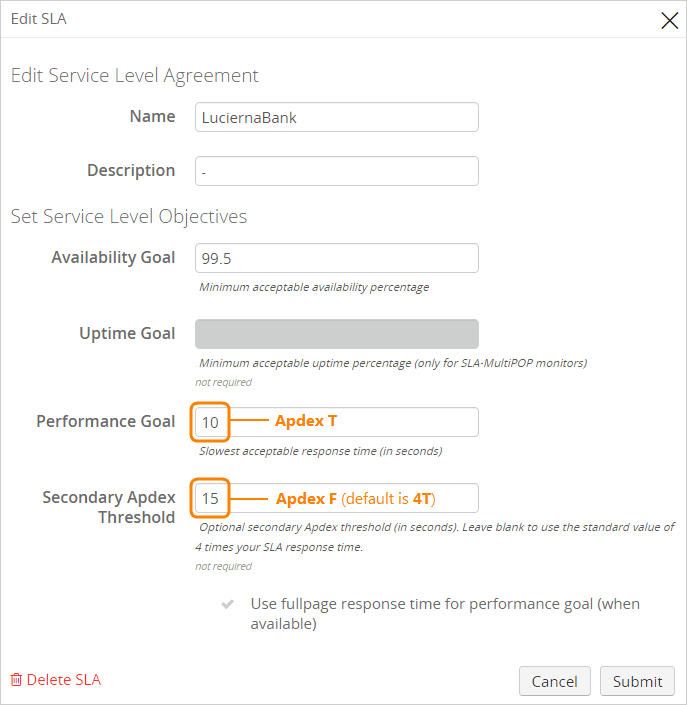
You can set Apdex thresholds for a monitor in the SLA configuration for that monitor. To create or edit SLAs, select SLAs > Summary from the top menu. Apdex T is the value of the Performance Goal edit box, and Apdex F is the optional secondary threshold (the default value is four times the performance goal).
For monitors without an SLA, Apdex T is 2 seconds per page, and Apdex F is 8 seconds per page (that is, four times Apdex T). For multi-step monitors, multiply that by the number of steps. For example, for a 3-step transaction the default Apdex T is 6 seconds, and Apdex F is 24 seconds.
Example
A real-browser monitor includes 3 pages, and has the Apdex tolerating threshold of 6 seconds (2 seconds per page).
The pages load in 2.5 seconds, 1 second, and 2 seconds.
The total monitor run time is 5.5 seconds = Satisfied, even though the first page takes more than 2 seconds to load.
Base Response Time vs Full Response Time
For website monitors, Apdex T is compared against the full page response time, unless:
-
the monitor does not use fullpage time monitoring
-
the monitor’s SLA explicitly specifies the non-fullpage response time goal (that is, the Use fullpage response time for performance goal check box is clear)
In these cases, Apdex compares the threshold to the base page response time (the load time of just the page’s HTML code, without images and other external files).
See Also
Availability
Web Page Load Time
AlertSite UXM Dashboard
Monitor Groups

