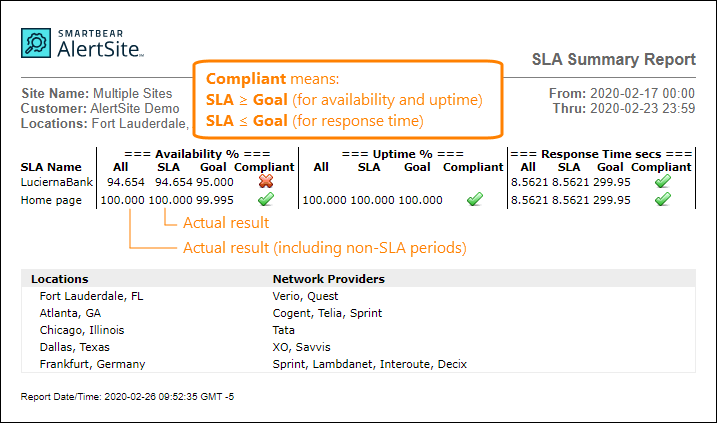
This report is for monitors that have Service Level Agreement (SLA) objectives configured for availability, uptime, and response time. It shows the SLA compliance for one or more monitors and date ranges for up to 1 year.
Create the report
AlertSite UXM
-
Go to Reports > Performance Reports.
-
Select the SLA Summary report.
-
Select one or more SLAs.
-
Select one, several, or all locations. AlertSite will calculate SLA compliance using monitoring results from these locations only.
-
Select the report period. You can use a relative period such as This Month or an exact period up to 1 year.
-
(Optional.) Use the Enhanced Time Controls filter to include or exclude data for specific days of the week or for specific time of the day.
-
Click Run Report.
AlertSite 1.0
-
Go to Reports > Performance Reports.
-
Select one or more monitors with SLAs.
-
Select the SLA Summary report.
-
Select one, several, or all locations. AlertSite will calculate SLA compliance using monitoring results from these locations only.
-
Select the date range. You can use a relative period such as This Month or an exact period up to 1 year.
-
(Optional.) Set the Time Filter to include or exclude data for specific days of the week or for specific time of the day.
-
Click Create Report.
Once the report is ready, you can view, email, or schedule it. For more information, see Scheduling Reports.
Report data
The report contains summarized information from the SLA Summary dashboard. For each SLA, you can see the SLA objectives (Goal), the site’s actual results during SLA operating periods (SLA), and the results for the whole reporting period including non-SLA periods (All). To be SLA-compliant, the values in the SLA column must be greater than or equal to availability and uptime goals and less than or equal to the response time goal.
Service level objectives are defined as follows:
-
Availability – Percentage of successful tests out of all tests.
-
Uptime – Percentage of time when the site was accessible from at least one location. This is not the same as availability – a site can be up, but not available in some locations because of a network outage. Uptime metric is available only for monitors with the SLA (MultiPOP) monitoring mode and 2 or more locations.
-
Response time – Average response time, in seconds, over the reporting period.
For more information about these metrics, see About Service Level Agreements.

