You can add service level agreements (SLA) to your monitors to define the acceptable parameters of operation for your websites and APIs. You can set SLA objectives for uptime, availability, and response time (or full page response time). Once set, you can use AlertSite dashboards and reports to review the monitor metrics as compared to the SLA goals.
| Note: | You need to be an Admin, Co-Admin or Power User to create or edit SLAs. |
1. Prepare the monitor
To monitor SLA compliance, you first need to create monitors for your key pages and transactions.
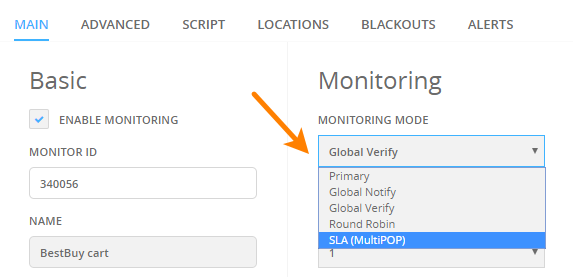
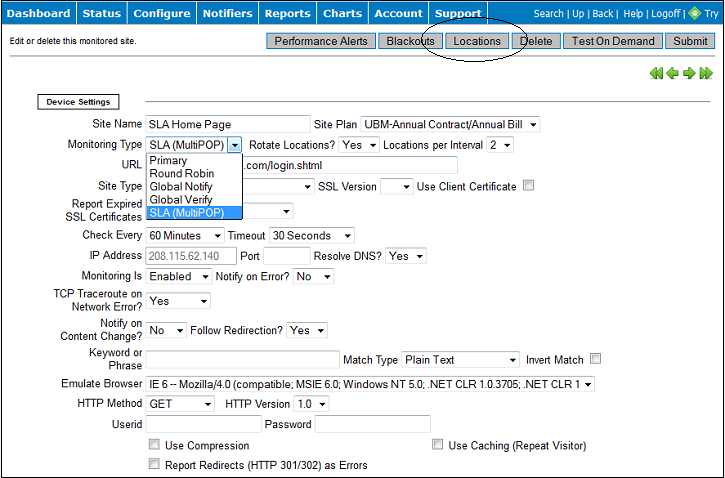
If you want to monitor uptime in addition to availability, configure the monitor with the SLA (MultiPOP) monitoring mode and at least 2 locations. This mode is available for all monitors except those using private monitoring locations (Private Node Server or InSite). You can choose to rotate locations, with 2 or more locations per interval.
Uptime monitoring requires multiple locations, because locations coordinate with each other to see if the site is up or down globally. For example, if two out of three locations can reach your site, it is still considered up. It is only considered down when no locations can reach it.
You can also use other monitoring modes – Global Verify, Primary, and others. In this case, you will be able to set SLA for availability and response time, but not uptime.
2. Create an SLA
AlertSite UXM
-
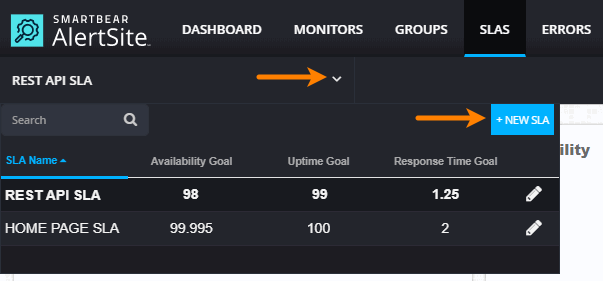
From the top menu, select SLAs > Summary.
-
Open the list of SLAs at the top left and click New SLA.
-
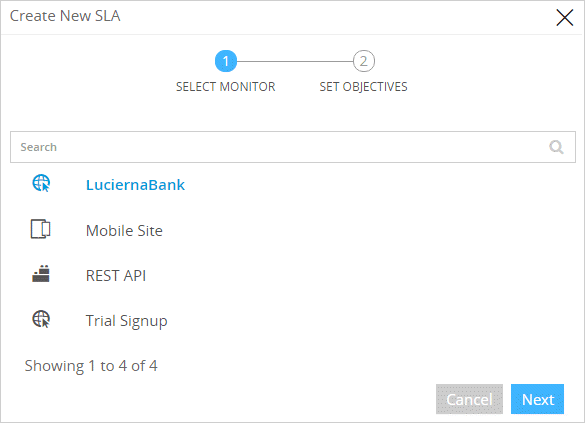
Select the monitor for the new SLA and click Next.
-
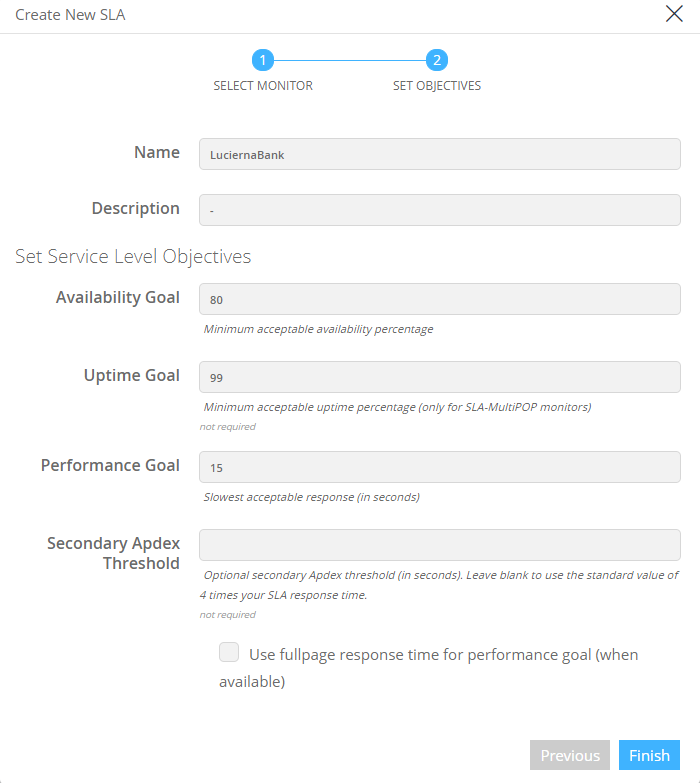
On the next screen, enter the SLA name, description, and the SLA objectives:
Option Description Availability Goal
The minimum acceptable percentage of successful tests. For example, 95%. The value can have up to three decimal places.
Uptime Goal
Only for monitors with the SLA (MultiPOP) monitoring mode and at least 2 locations. Specifies the minimum acceptable uptime as a percentage, with up to three decimal places. For example, 99.999%. A website is “up” if at least one location performed a successful test during the monitoring interval. Uptime goal can be equal to or greater than the availability goal.
Performance Goal
The maximum acceptable response time in seconds, with up to two decimal places. Also used as the Apdex T threshold between satisfying and tolerating performance. For multi-step monitors, this includes the total time of all steps.
Secondary Apdex Threshold
Optional. The Apdex F threshold between the tolerating and frustrating performance. Must be greater than the Performance Goal. If left blank, defaults to four times the Performance Goal. For multi-step monitors, this value includes the total time of all steps.
Use full-page response time for performance goal (when available)
Only for website, real browser (DéjàClick) and mobile web monitors with full-page monitoring enabled. Select this option to apply the SLA performance goal to the full-page response time (the load time of the entire page with all embedded objects, images, scripts, and stylesheets). If not selected, the SLA is applied to the base page response time.
-
Once ready, click Finish.
-
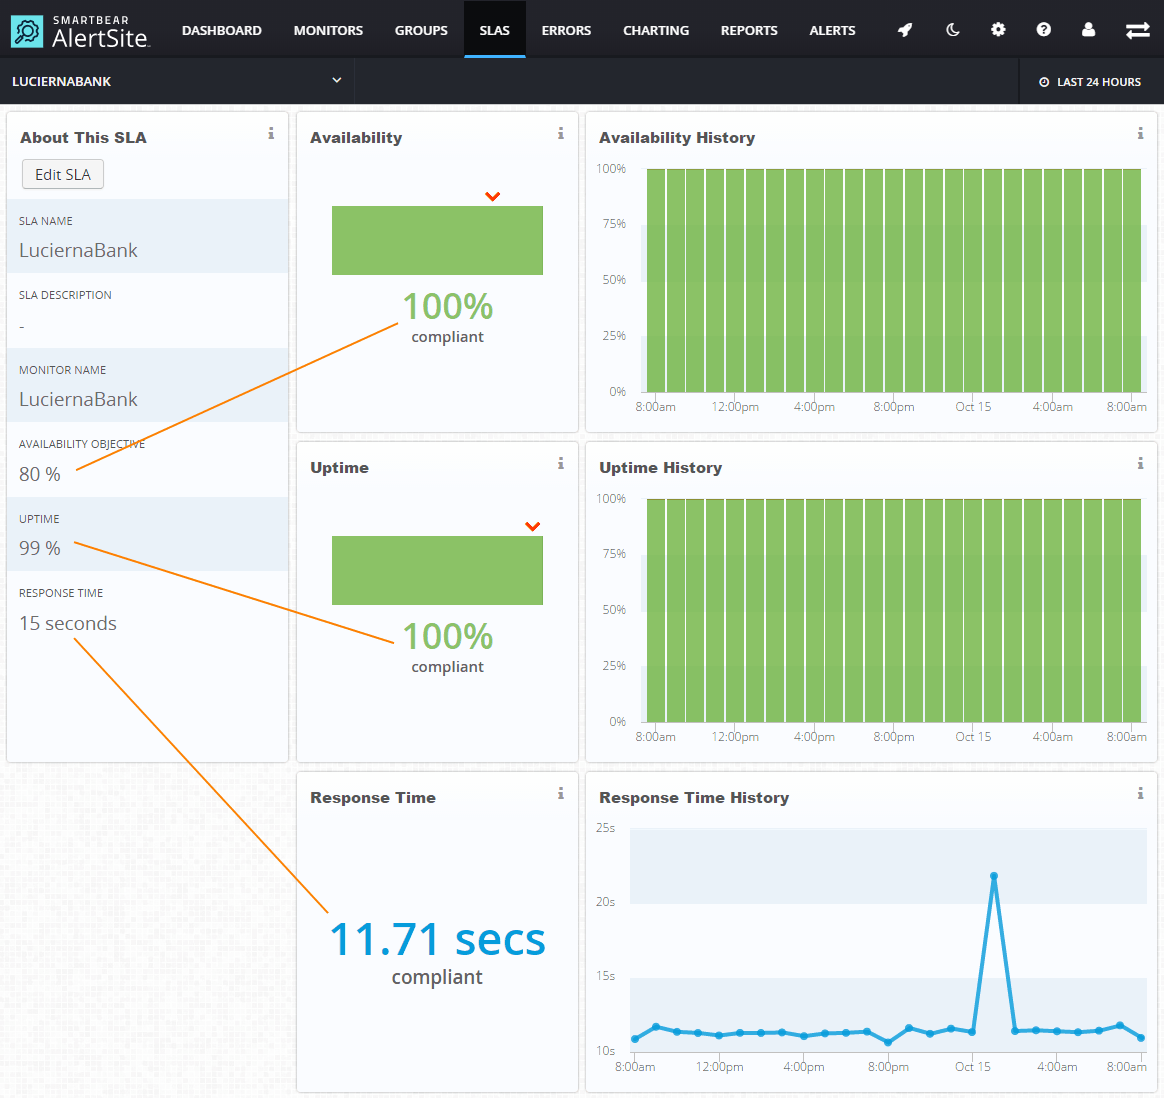
AlertSite UXM will calculate the SLA compliance and show it on the dashboard.
AlertSite 1.0
-
From the top menu, select Configure > SLA Objectives.
-
Click Add a new SLA at the upper right. You will see the list of account monitors that have not been configured with SLA objectives, for example, the remaining 9:
-
Click the needed monitor in the list.
-
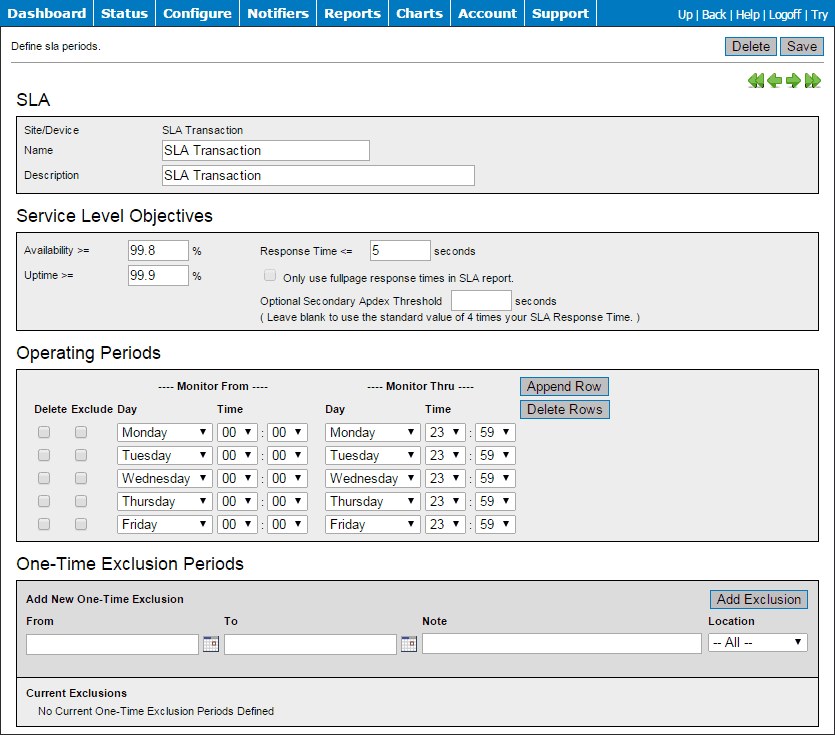
Enter the SLA name, description, and the SLA objectives. For example, the picture below shows the SLA Objectives for the SLA Transaction transaction monitor, with a minimum of 99.8% Availability, 99.9% Uptime, and Response Time expected to be less than or equal to 5 seconds over an operating period of Monday through Friday. There are no exclusions, either weekly or one-time:
-
Once ready. click Save.
-
AlertSite 1.0 will calculate the SLA compliance and show it on the Configuration: SLA Objectives screen.
3. Define SLA operating periods
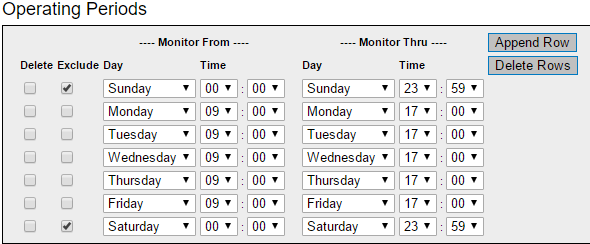
SLA operating periods are the days and hours when the SLA is in effect. The default operating period for new SLAs is 24/7. However, some application SLAs are only enforced on specific days and hours, such as business hours (Monday–Friday, 9 AM–5 PM). If so, you need to configure your SLA schedule appropriately. Data falling outside of SLA operating periods will not be included in your SLA calculations.
To define SLA operating periods:
AlertSite UXM
-
Go to SLAs > Op Periods/Exclusions.
-
Select your SLA from the list at the top.
-
Click Edit Operating Periods.
-
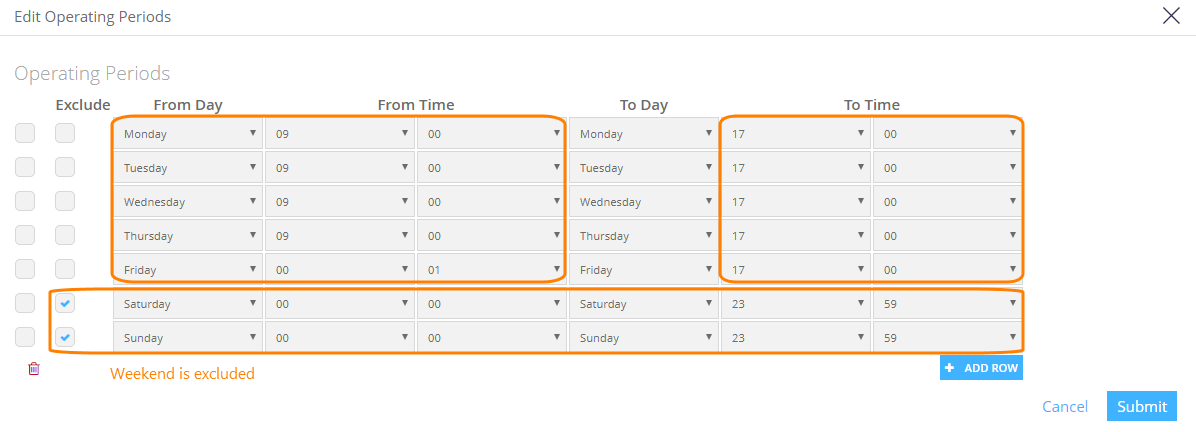
For each day, select the hours of the day covered by the SLA.
To exclude specific days like weekends, select the Exclude check box next to them.
Below is an example for Monday–Friday, 9 AM–5 PM.
-
Click Submit.
AlertSite 1.0
-
From the top menu, select Configure > SLA Objectives.
-
Click the needed monitor with configures SLA objectives on the Configuration: SLA Objectives screen. If the screen does not list any monitors, click Add a new SLA and continue with the steps described above.
-
In the Operating Periods section, for each day, select the hours of the day covered by the SLA.
To exclude specific days like weekends, select the Exclude Day check box next to them. Below is an example for Monday–Friday, 9 AM–5 PM.
-
Click Save at the upper right.
4. Add one-time exclusions
SLA exclusions are one-time instances when the SLA is not in effect, such as during scheduled maintenance. Monitoring stills happens, but the results are not included in your SLA calculations.
To add an exclusion:
AlertSite UXM
-
Go to SLAs > Op Periods/Exclusions.
-
Select your SLA from the list.
-
Click Edit Exclusions.
-
Click Add Row.
-
Specify the start time, end time, and a description. You can add both future and past dates.
-
By default, exclusion applies to all monitoring locations, but you may select a specific location.
-
Add other exclusions if needed.
-
Click Submit.
AlertSite 1.0
-
From the top menu, select Configure > SLA Objectives.
-
Click the needed monitor with configures SLA objectives on the Configuration: SLA Objectives screen. If the screen does not list any monitors, click Add a new SLA and continue with the steps described above.
-
In the One-Time Exclusion Periods section, specify the start time, end time, and a description. You can add both future and past dates.
-
Click Save at the upper right.
Monitoring data from these periods will now be excluded from SLA calculations.
SLA alerts
Monitors with an SLA follow the usual AlertSite alerting rules. For example, they send availability alerts on HTTP errors, missing keywords, and other conditions specified in the monitor settings. To receive response time alerts, you will need to set performance thresholds in the monitor settings as explained in Performance Alerts.
Alerts are always based on the test results, rather than on how the results compare to the SLA goals. This is because the SLA goal is an average over a given reporting period – day, week, month, and so on. Typically, a spike in the response time can usually be ignored as long as the average is OK.
SLA (MultiPOP) alerting specifics
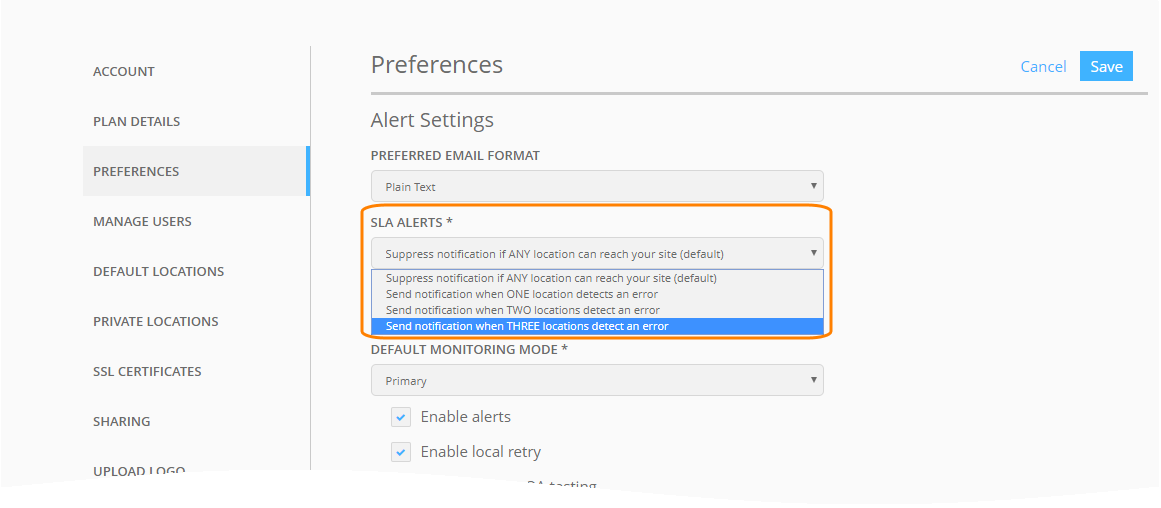
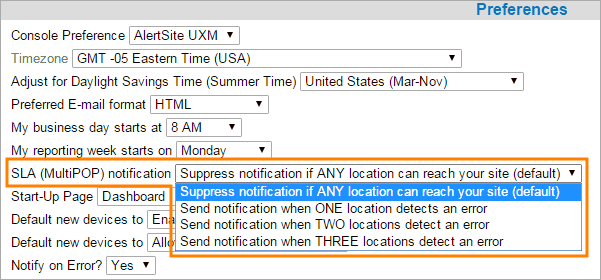
Monitors with the SLA (MultiPOP) monitoring mode have an extra option to control availability alerts – you can specify the minimum number of error locations for an alert to trigger. You can choose to be notified if 1, 2, 3, or all monitoring locations detect an error at the during the same run interval.
AlertSite UXM
-
From the top menu, select > Settings.
-
Switch to the Preferences tab.
-
Choose when availability alerts should be sent:
For example, to get an alert only when ALL locations detect an error, select Suppress notification if ANY location can reach your site. In this case, if only one location detects an error, you will not be notified.
-
Click Save.
AlertSite 1.0
-
From the top menu, select Account > Manage Account.
-
In the Preferences section, choose when availability alerts should be sent:
If you want to be notified when, say, at least 2 of your monitoring locations have detected an availability error during the monitoring interval, select Send notification when TWO locations detect an error from the drop-down list. If an error is detected from only 1 location during the interval, you would not be notified. The condition would be reported as an error in the SLA Report, but you would not receive an alert.
-
Click Submit Changes at the upper right.
Notes:
-
Even when alerts are suppressed by this option, the errors are still indicated in the SLA reports.
-
This option affects only availability alerts like timeouts or HTTP errors. It does not affect performance alerts, which have their own settings for minimum locations.
See Also
About Service Level Agreements
SLA Summary Dashboard
SLA Operating Periods and Exclusions

