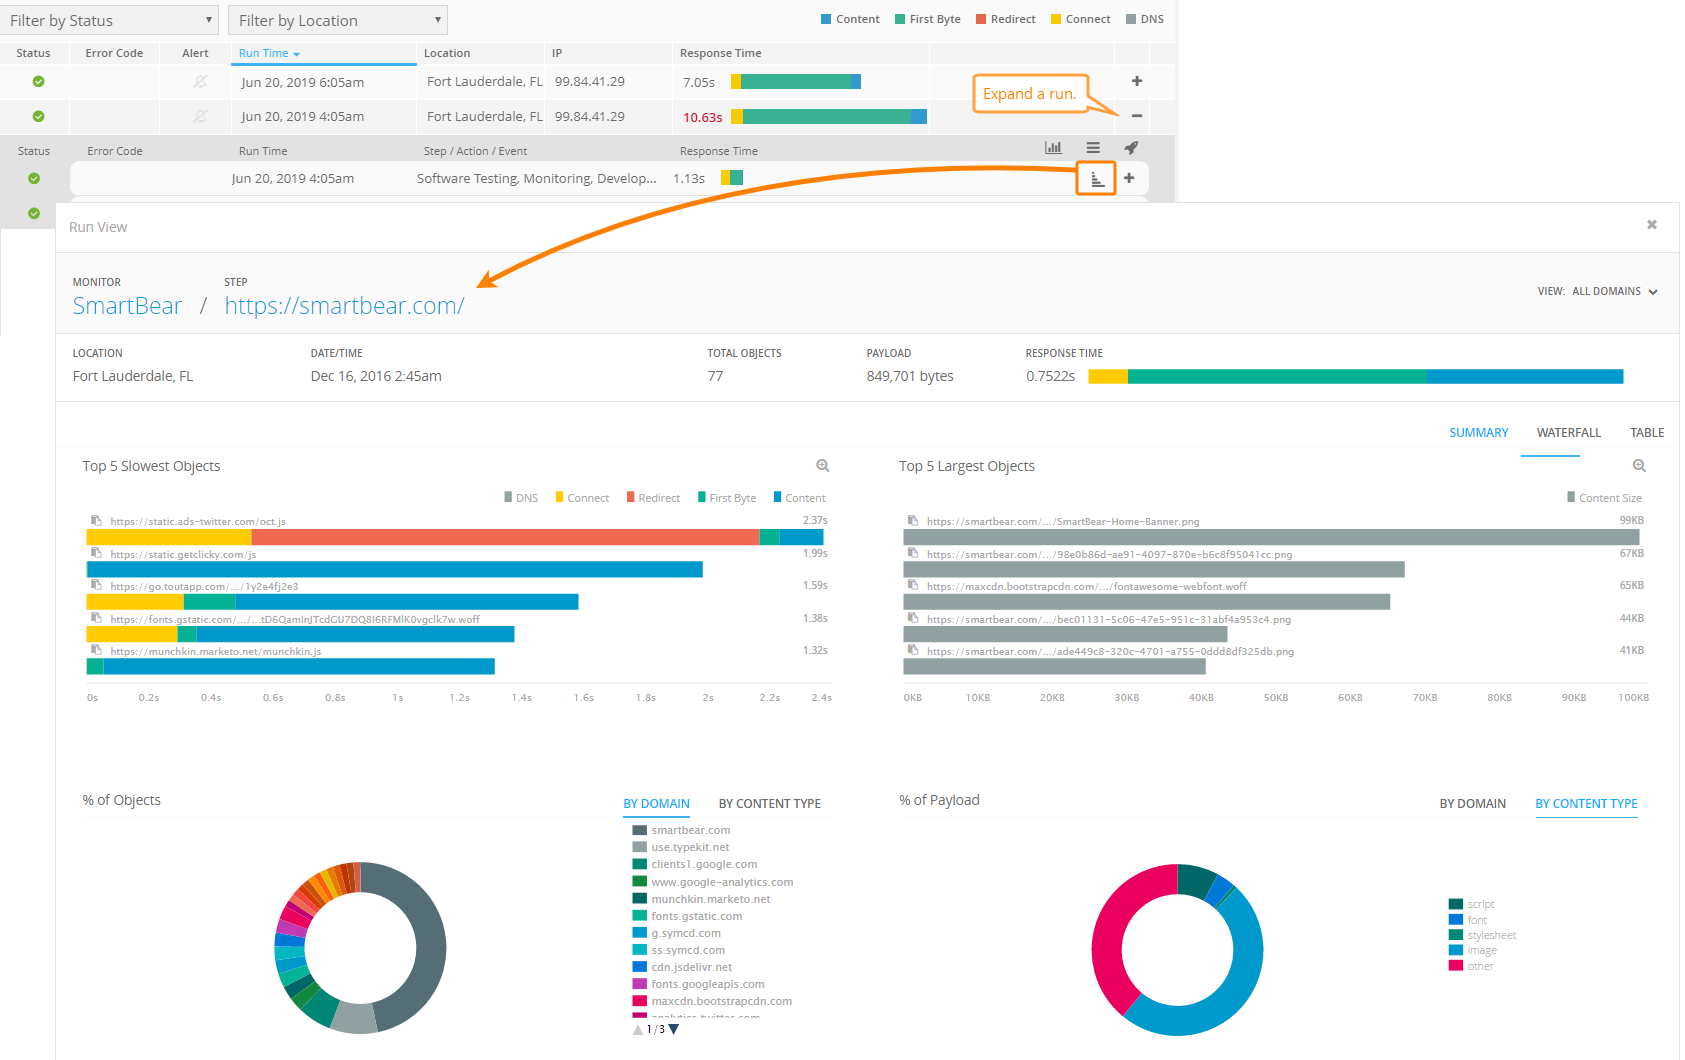
AlertSite tracks the page load time and network activities for all monitor steps, helping you analyze your website performance. You can access the page loading timeline and detailed timing data from the Monitor Runs dashboard:
-
Select a monitor and time frame.
-
Expand a run.
-
Click next to a step.
Understanding the Data
Monitor and Step Info
The header provides high-level information about the page that was loaded.

| Item | Description |
|---|---|
|
Monitor |
The monitor name. |
|
Step |
The step name (for multi-step monitors). |
|
Location |
The monitoring location that performed the test. |
|
Date/Time |
The date and time of the test. All timestamps use the time zone specified in your AlertSite settings in > Settings > Preferences > Time Settings. |
|
Total Objects |
The number of HTTP requests made for the pieces of content on the page (images, JavaScript, CSS, Ajax requests, and so on). |
|
Payload |
The amount of data downloaded in order to load the page. |
|
Response Time |
The base page response time (just the page’s HTML, without images, scripts, or other files). |
Views: All Domains, In-domain, Out-of-domain
The dropdown at the top right lets you filter the displayed page objects based on whether they are from your monitored server or from other servers. The filter affects all views – Summary, Waterfall, and Table.
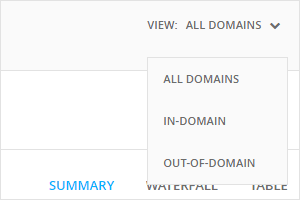
All Domains – Shows all resources.
In-Domain – Shows only objects from the same domain as the monitored page.
Out-of-domain – Shows only third-party content like analytics scripts, social widgets, CDNs, and so on.
Summary View
The summary view appears for monitors that use the fullpage monitoring. It provides aggregate content statistics for the selected monitor step.
The Summary helps you answer the following questions:
-
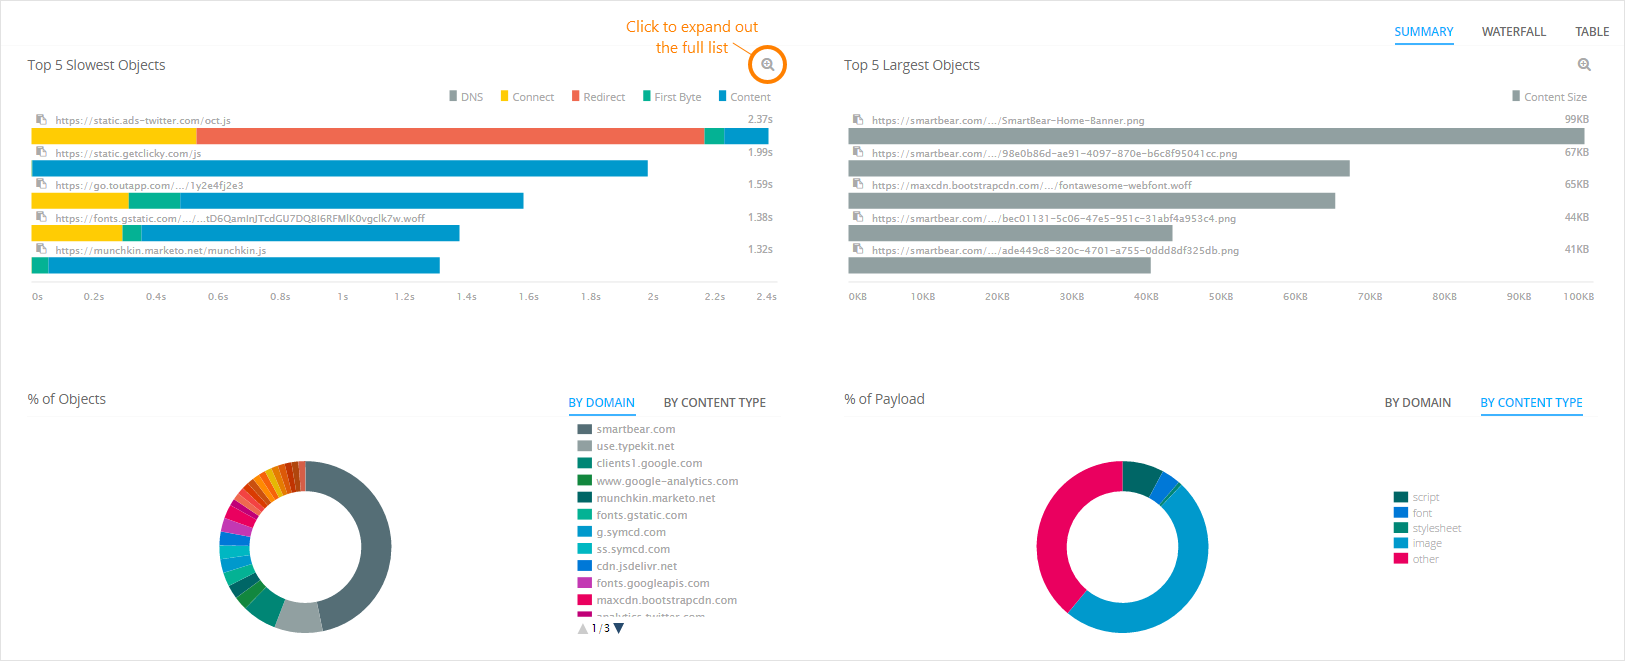
Which objects take the longest time to load? (Top 5 Slowest Objects)
-
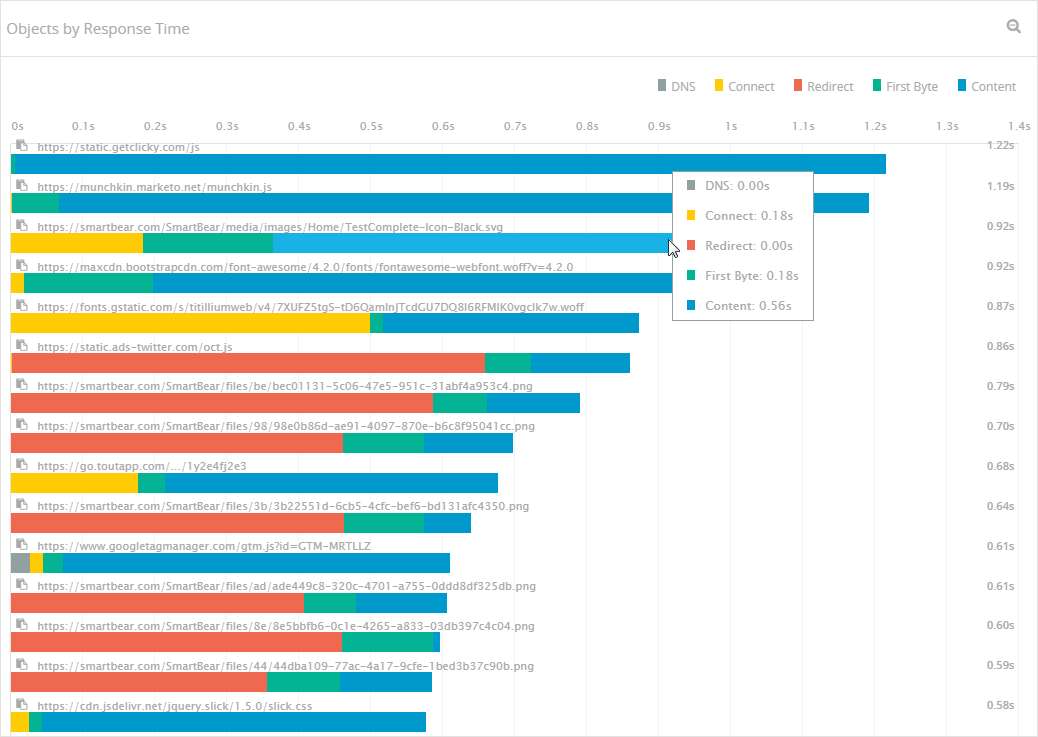
Where is the time spent when loading the slowest objects? (Network timings in tooltips)
-
What are the largest objects by size? (Top 5 Largest Objects)
-
What is the content breakdown by domain? (% of Objects/Payload by Domain)
-
What is the content breakdown by type (images, scripts, CSS, fonts, content, other)? (% Objects/Payload by Content Type)
To learn which objects have the most impact on your page load time, check out the Top 5 Slowest Objects and Top 5 Largest Objects charts. Clicking at the top right of a chart will expand it to show a full list of objects. Hover over each object to see its network timings in a tooltip.
| Tip: | You can copy URLs from the waterfall by clicking next to a URL. |
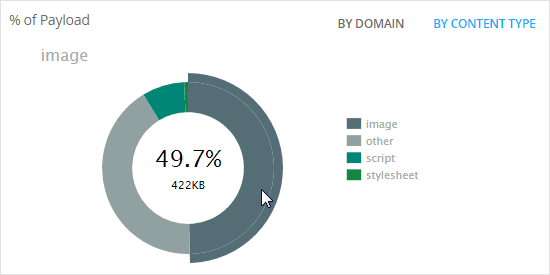
At the bottom, the pie charts % of Objects and % of Payload show the content breakdown by domain and content type.
Waterfall Chart
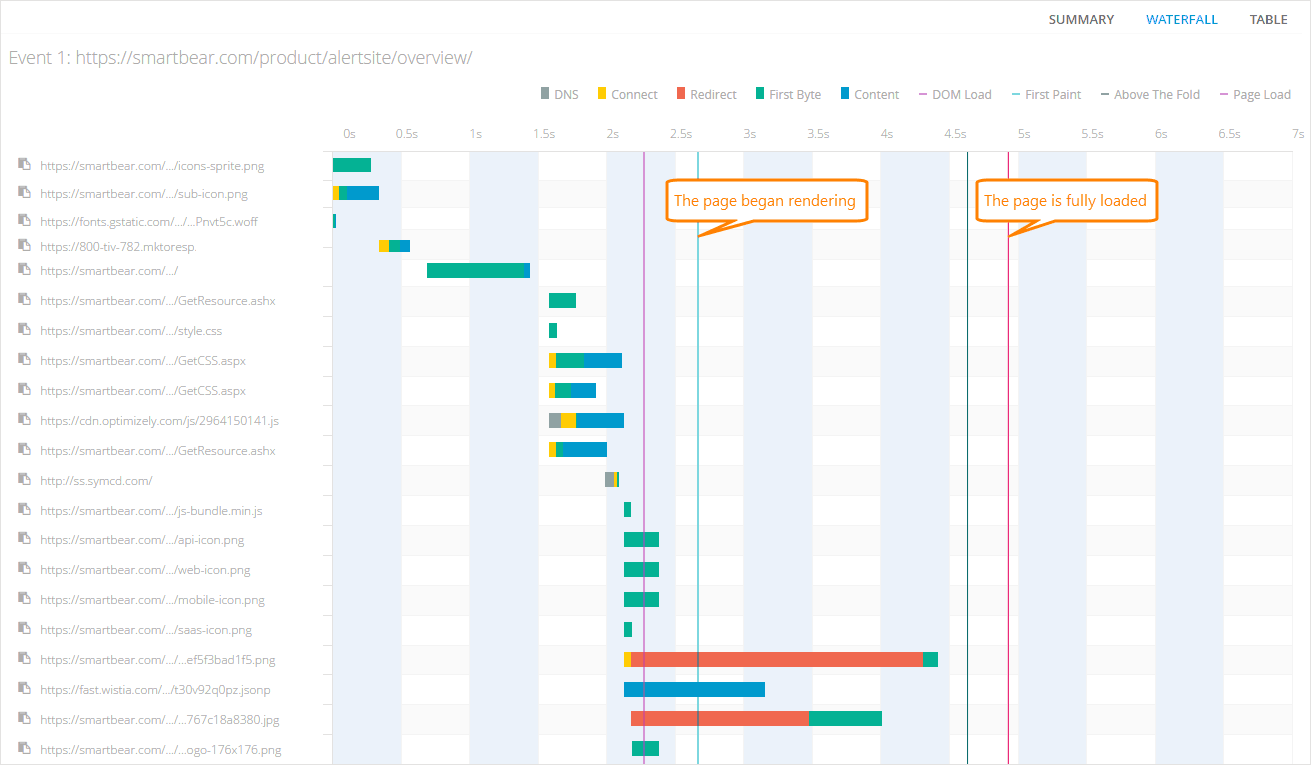
The waterfall chart visualizes the page loading timeline and all network activities, from the moment when an HTTP request was initiated until the moment the last byte of the response was received.
The response time is broken down into categories, showing how much time is spent doing the following:
-
DNS lookups
-
Connections
-
Redirects
-
Waiting for first byte of response
-
Content download
Vertical lines on the chart indicate page rendering events for DéjàClick and Selenium monitors:
-
DOM Load – the
DOMContentLoadedevent, fired when the browser has downloaded the page’s HTML and finished constructing the Document Object Model (DOM). -
Page Load – the
onloadevent, fired when the page and all referenced resources (images, scripts, and so on) have been fully loaded into the DOM. -
First Paint – the browser started rendering the page.
-
Above the Fold – the visible portion of the page (all content that is visible without scrolling) has “stabilized”.
For more information about these metrics, see Web Page Load Time.
Table View
The table view lists all resource URLs and the response time breakdown into individual network timings. The table is sortable so you can sort the URLs by individual network timings by HTTP status or alphabetically by URLs. Use the View dropdown at the top right to filter the content by in-domain or out-of-domain.

