
The Config dashboard lets you visualize and compare core monitor settings side-by-side. The Config screen is accessible from the AlertSite UXM Dashboard by using the “compare” command.

Click the image to enlarge it.
Open the dashboard
-
Go to Monitors > Overview.
-
Switch to the Config tab.
-
In the list on the left, select the monitors and groups you want to compare.
Note: Selecting a group will replace the previous selection with the monitors from that group. To combine a group with other monitors, select the group first.
Column descriptions
The Config screen has the following columns. You can sort the data on any column.
| Column | Description |
|---|---|
|
Name |
The monitor name. |
|
Id |
The monitor ID. These IDs can be used with AlertSite APIs. |
|
Type |
The monitor type. |
|
URL |
The monitored URL or the URL of the first monitor step. |
|
Step Count |
The number of steps if this is a multi-step monitor. |
|
Monitoring Enabled |
Specifies whether the monitor is enabled or disabled. |
|
Performance Alerts |
Specifies whether performance alerts are enabled for the monitor. |
|
Availability Alerts |
Specifies if availability alerts are enabled for the monitor. |
|
Blackouts Enabled |
Specifies whether the monitor has blackouts: indicates future one-time blackouts.
|
|
SLAS |
Specifies whether the monitor has a service-level agreement configured. |
|
Mode |
The monitoring mode. |
|
Rotated |
Specifies whether the monitor uses the Rotate Locations option. |
|
Locations Per Interval |
The number of monitoring locations used per each monitor run. |
|
Locations Count |
The total number of monitoring locations used by the monitor. |
|
Locations |
The names of monitoring locations used by the monitor. |
|
Plan |
The monitoring plan used by the monitor. |
|
Recipient Groups |
The recipient groups that the monitor belongs to. |
|
Reporting Enabled |
Specifies whether the monitor is included in any scheduled reports. |
|
Interval |
How often the monitor runs. |
|
Options menu |
– Opens the monitor settings. – Deletes the monitor. |
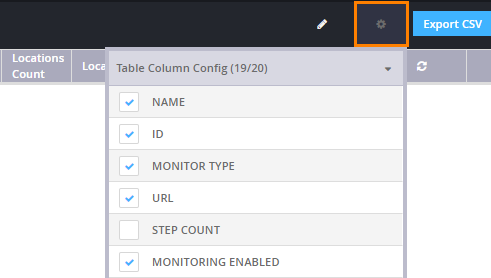
Show or hide columns
You can resize, rearrange, and select which columns will be shown on the Config dashboard.
To select the columns:
-
Click on the dashboard toolbar.
-
Use the check boxes to select the columns you want to be displayed.
Export to CSV
You can export the monitor configuration summary to a CSV file. In addition to the settings displayed on the Config screen, the CSV file includes monitor and alert notes. To export the CSV file, click Export CSV in the top right corner of the page.