
LoadComplete can track various performance metrics of tested web servers, such as CPU load, memory usage and so on, during test runs. You use the Add Counter wizard to specify the servers you want to monitor and to add counters that will measure the performance of your tested web server.
To Open the Wizard
-
Open the Counters page of your project. To do that, double-click the Counters item in the Project Explorer.
-
Click
 Add Counter on the page toolbar.
– or –
-
Open the Runtime > Graphs page of your project.
-
Expand the Server performance group in the list of available counters. If the list is hidden, click
 Show Counter List on the page toolbar.
 -
Click the
Add Counter link.
Select Server to Monitor
On the Select Server for Monitoring page of the Add Counter wizard, you specify the tested web server whose performance you want to monitor:

The wizard shows this page only if you are monitoring web servers in your project. Otherwise, it will show the Specify Server Address page.
To add a new performance counter to a server you are already monitoring in your project, click the needed server in the list.
To add performance counters to a new server, click  Add a new server.
 Your current computer must have access to your tested web server and the server must be prepared for monitoring as described in Preparing Servers for Monitoring.
Click Next to proceed.
Specify Server Address
On the Specify Address of a New Server page of the Add Counter wizard, you specify the tested web server whose performance you want to monitor:

The wizard shows this page if you are not monitoring any servers in your project, or if you chose to add a new server to monitor on the previous page of the wizard.
You can type the server network name or IP address manually, or you can click the ellipsis button and select the server in the Select Host dialog.
Your current computer must have access to your tested web server, and the server must be prepared for monitoring as described in Preparing Servers for Monitoring.
After specifying the server, click Next to continue.
Select Performance Provider
On the Select a Provider of Performance Counters page of the Add Counter wizard, you select a counter provider to get the performance data from the tested web server:

The following providers are available:
| Note: | For each server, you can add only one provider of each type. (This does not concern the Apache Server Statistics and Oracle Statistics providers. You can add any number providers of these types to servers.) |
Select the needed provider in the list and click Next to proceed.
Configure Provider
On the Configure Provider page of the Add Counter wizard, you specify the parameters needed to obtain performance data from the selected provider.
The wizard shows this page only if you have selected the Oracle Statistics provider or the Apache Server Statistics provider. The image below is a sample view of the page for the Oracle Statistics provider:
")
-
For the Apache Server Statistics provider, specify the port your Apache server uses. (Your web server can have several Apache servers running and using various ports.)
-
For the Oracle Statistics provider:
-
In the Port text box, enter the port your Oracle database uses.
-
In the Login and Password text boxes, enter the credentials you use to connect to the database.
Note: The account you use to connect to the database must have access to the V$METRICtable of the database. -
In the Server text box, enter the SID (unique identifier) of your Oracle database on your tested server.
-
After specifying the parameters, click Next to continue.
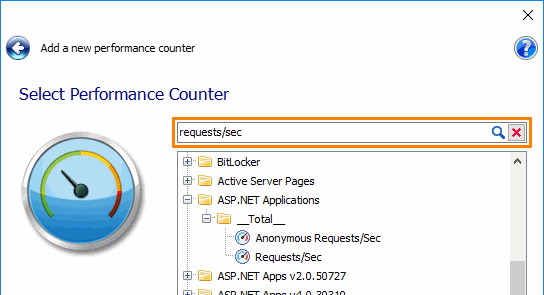
Select Performance Counter
On the Select Performance Counter page of the Add Counter dialog, you select a performance counter that LoadComplete will monitor on your tested web server during the test run.
What counters the page lists depends on the provider you selected on the previous page of the wizard. Below is an example of the page displayed for the Windows Performance Monitor provider:

For information on providers and counters, see:
To find a counter quickly, type any part of its name in the Quick Search text box. The page will filter out its contents according to the text you are typing:
Click Finish to complete adding the counter, or, if the selected counter’s data provider does not return the type of data the counter measures, click Next to select the data type.
Select Data Type
On the Select the Type of Data the Counter Will Monitor page of the Add Counter wizard, you specify the type of data the selected performance counter measures:

The wizard shows this page if the provider of the selected counter does not return the type of data the counter measures.
The data type defines how the counter interprets the returned data. If you select an inappropriate data type, the counter will provide false data. For example, if your counter returns data in bytes, select Bytes as the counter data type. Do not select Kilobytes, Megabytes, or Gigabytes.
The selected type does not affect the scale the graphs will use to show the counter on the Runtime > Graphs page or on the Infrastructure > Server Monitoring page of the Report test log.
Select the needed data type and click Finish to complete adding the counter.