About the Graphs Page
On the Runtime > Graphs page of your project, you can monitor various performance metrics of your tested web application or website, including the metrics that reflect the performance on the client side and on the server side.
Below are sample images of the page:
|
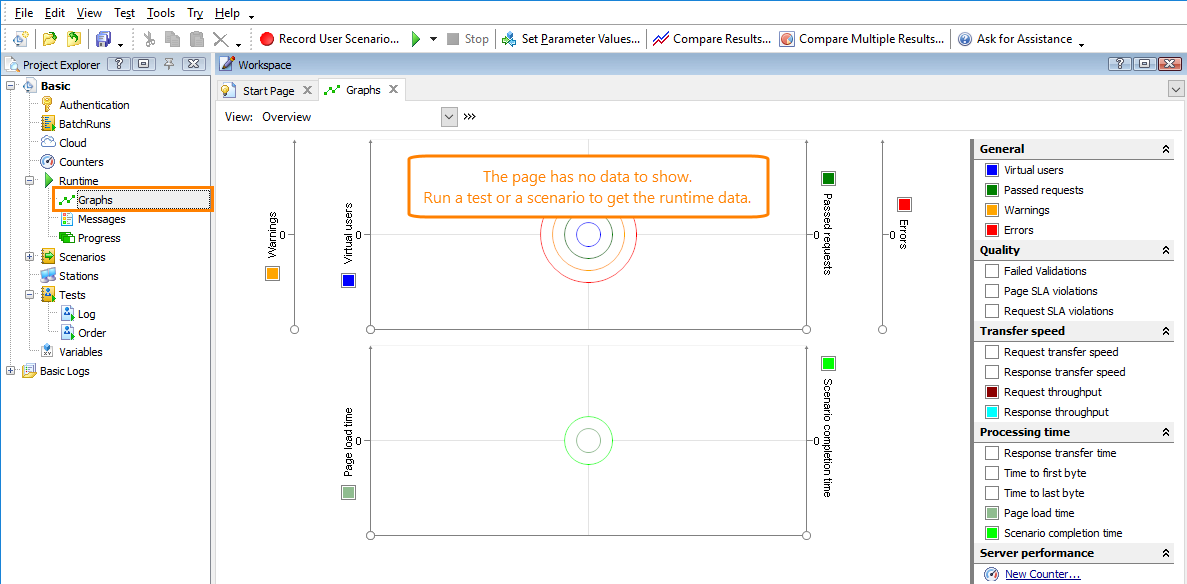
The page with no data, before any test or scenario is run |
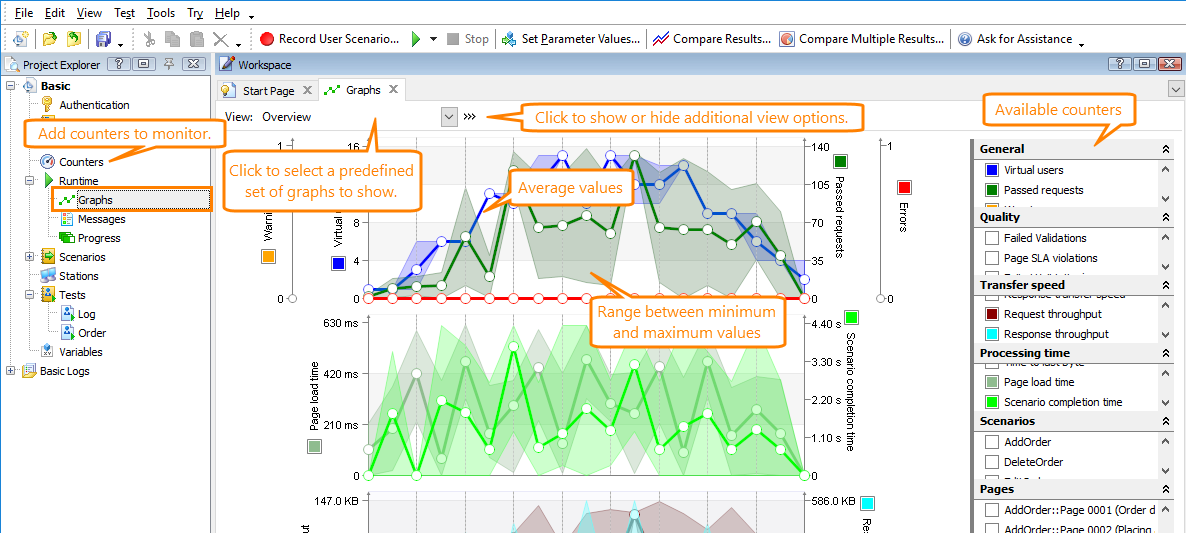
The page with runtime data |
If you haven't run any test or scenario yet, the page shows circles, which means no data has been collected. During the test run, the page gets metric values every second and plots them on the graphs.
The thick line on the graphs shows the average values at any moment of the test run. You can also view variations between the minimum and maximum values as a semi-transparent area.
Notes:
-
If the average, minimum and maximum values coincide, the graphs will show only the average values.
-
As you zoom in or out the graphs, LoadComplete re-scales the time axes and re-calculates the average, minimum and maximum values respectively. This may affect the way the graphs look.
The page stores graphs only for one test run. When you close the project, all data on the page is cleared. You can get runtime metrics for the active or previous test run until your LoadComplete project is closed.
Counters (Metrics)
The page can show one or several graphs, and each graph can show one or several metrics (we also call them counters). There are several predefined counters you use to monitor basic metrics. They include Page Load Time, Passed Requests, Response Transfer Speed and other counters.
In addition to the basic counters, LoadComplete can get performance counters from the server. Depending on the server’s operating system and on various server parameters, the set of counters available for monitoring may vary.
For information on the available counters, see:
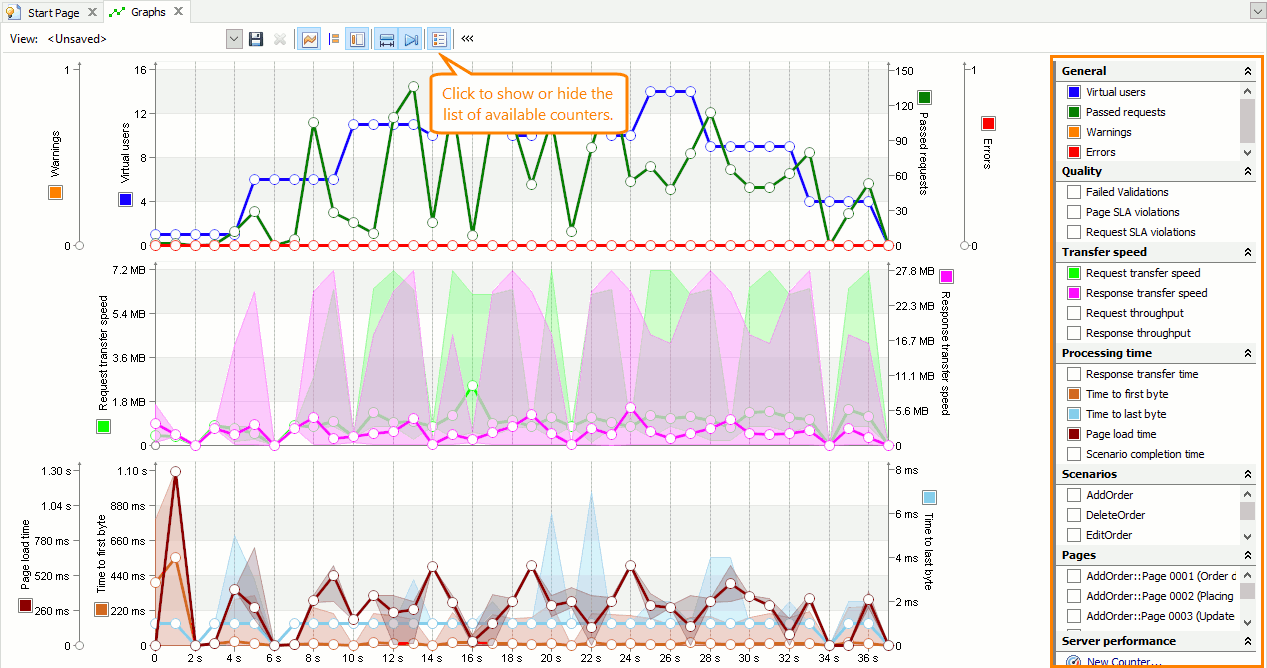
The page shows a list of available counters on the right:
If the list is hidden, click  Show Counter List on the page toolbar. Counters are grouped by the data they measure. You can expand and collapse counter groups by clicking the arrow buttons on the group header.
You can enable and disable counters on the graphs and specify the color used to display a counter. You can also move the counters on the page, merge or separate them. To learn more, see the counter-related subsections of the Working With the Page section below.
Views
A view is a predefined set of graphs that represent various aspects of the server performance. By default, the following views are available:
-
Overview - Shows several graphs that represent the performance of the tested web application or web site: the number of virtual users, the number of errors and warnings, the transfer speed, and the transfer time.
-
Transfer speed - Shows a graph that demonstrates how quickly requests are sent to the server and how quickly server responses are received.
-
Basic quality - Shows a graph that demonstrates how the number of virtual users affects the number of errors and warnings.
-
Load time graph - Shows a graph that demonstrates how the website load time depends on the number of virtual users.
-
Server-side metrics - Shows graphs that demonstrate how the tested web server reacts to the load test. They include the counters added on the Counters page of the project.
You can also create custom views.
To activate a view, select it from the View drop-down list:
For each view, you can configure the following:
-
The counters it shows.
Note: If your custom view includes dynamic counters selected for the current project (for example, Scenarios or Pages), when you modify the view while another project is open, all the data of those dynamic counters will be discarded. -
Whether to show the list of all available counters to the left of the graphs.
-
How the graphs fit the page and how the graphs scroll the data.
-
Whether to show only average values or the range between the minimum and maximum values.
-
Whether to show the axes titles.
For detailed information, see the view-related subsection in the Working With the Page section below.
Working With the Page
 To add a server performance counter
 To remove a counter from a graph
 To move a counter to another graph
To show the toolbar
By default, the page toolbar is collapsed. To show the toolbar, click  .
.
To add a counter
-
In the list of available counters in the right part of the panel, find the needed counter. If the list is hidden, click
 Show Counter List on the panel toolbar.
 -
Select the check box next to the counter name.
-
The page will add a graph with the selected counter to the current view. If needed, you can drag the counter to another graph.
To add a server performance counter
 Do this before running your test or verifying a scenario.
-
In the list of available counters in the right part of the page, expand the Server performance group and click the
 New Counter link.
– or –
Open the Counters page of your project and click
 Add Counter on the toolbar.
 -
Follow the instructions of the resulting Add Counter wizard to specify the server you want to monitor and the counters that will retrieve the needed performance data. To learn more, see the wizard description.
-
LoadComplete will add the selected counter to the Server performance group of the Runtime > Graphs page.
-
In the list of available counters, enable the added server performance counters to monitor them during the test run.
To change the counter color
-
In the list of available counters in the right part of the page, find the counter the color of which you want to change. If the list is hidden, click
 Show Counter List on the panel toolbar.
 -
Right-click the color box next to the counter name.
-
Select the needed color in the resulting Color dialog, and then click OK.
To remove a counter from a graph
-
In the list of available counters in the right part of the panel, find the counter you want to remove. If the list is hidden, click
 Show Counter List on the panel toolbar.
 -
Clear the check box next to the counter name.
To move a counter to another graph
-
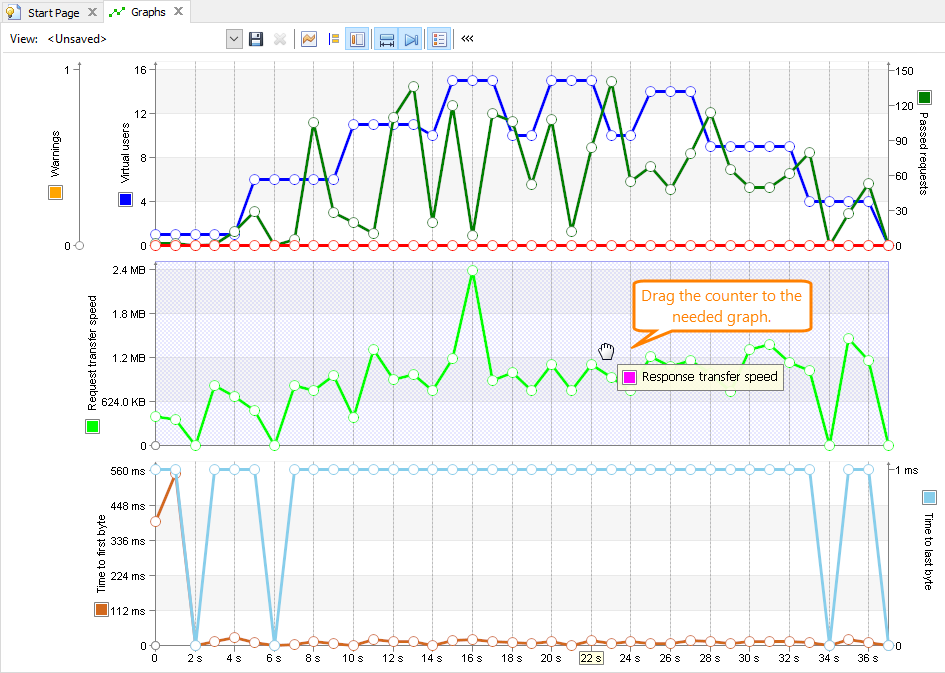
Move the mouse pointer to the counter title in the right or in the left part of the graph, or to any data point of the counter. LoadComplete will highlight both the counter and the title. If the title is not visible, click
 Show the titles of axes on the toolbar.
 -
Press the left mouse button and drag the counter to the needed graph. The page will highlight the target graph:
-
Release the mouse button.
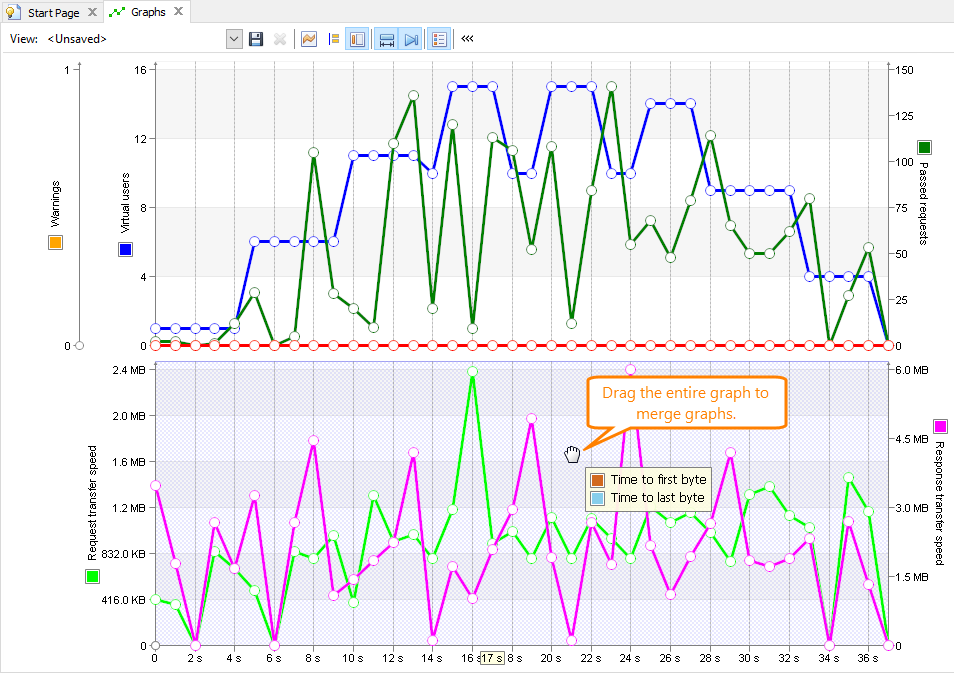
To merge graphs
-
Move the mouse pointer to any position within the graph you want to merge and press the left mouse button.
-
Drag the source graph to the graph with which you want to merge it. The target graph will be highlighted:
-
Release the mouse button.
-
All the counters from the source graph will be added to the target graph.
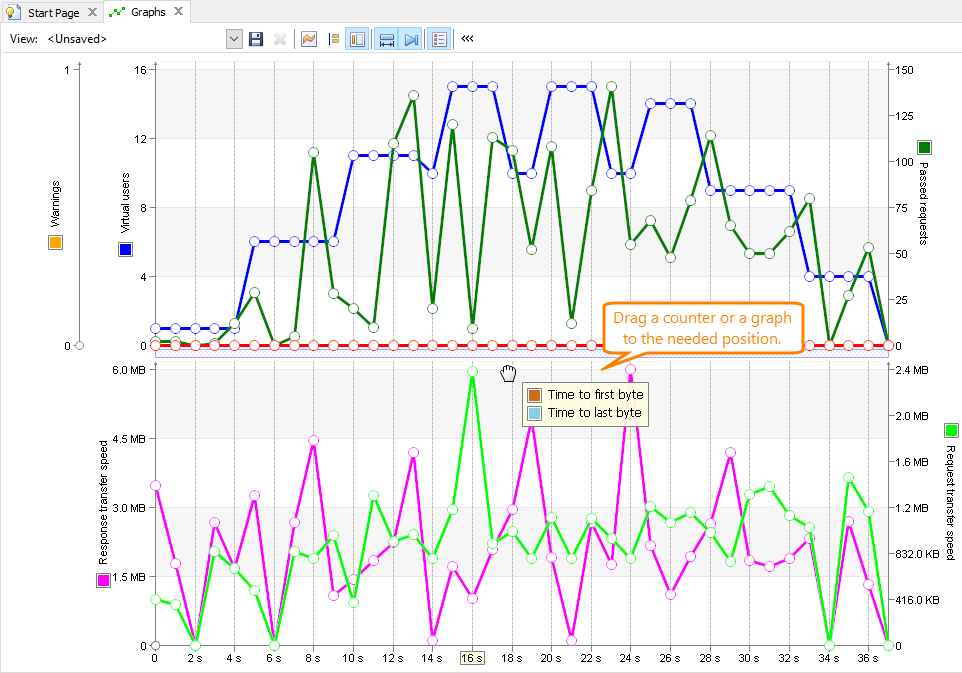
To arrange graphs on the page
-
Move the mouse pointer to any position within the graph you want to move and press the left mouse button.
-
Drag the graph to the needed position on the page:
-
To change the graph position, drag it to the needed place. The panel will highlight the area where the graph will be placed:
-
To merge a graph with another graph, drag it to the needed graph. The target graph will be highlighted:
-
-
Release the mouse button.
To zoom graphs
To zoom in or zoom out a graph, click the graph and scroll the mouse wheel.
– or –
Right-click within the graph and then click  Zoom In,
  Zoom Out or
  Zoom Default.
To zoom a graph so that it fits the page width, right-click within the graph and then click  Best Fit or click
  Best Fit on the page toolbar.
 When you zoom in and zoom out graphs, LoadComplete scales the time axes and recalculates the average values the graphs show. As a result, the way the graphs look may vary depending on the current zoom level. The current zoom level also affects the way the graphs show the range between the minimum and maximum values. If there is no variation between the minimum and maximum values for the current time intervals, the graphs will not show the value range.
To view the value range
The thick counter lines indicate the average values at any moment of the test run. To view the distribution of values between the maximum and minimum values at any moment of the test run, click  Show the Range of Values on the page toolbar. If the command is hidden, click
  to expand the toolbar commands.
If the average, maximum and minimum values are equal, the graph will show only the average values.
 When you zoom in or zoom out a graph, LoadComplete scales the time axes and re-calculates the values. If there are no variations between the minimum and maximum values for the current time interval, the graph will not show the value range.
To view values of data points
To view a counter value at a specific moment of the test run:
-
Hover the mouse pointer over the appropriate data point of a graph.
-
The graph will show the value for the data point.
To view the values of all available counters at a specific moment of the test run:
-
Click
 Show all the values on the page toolbar. If the toolbar is hidden, click
  to expand the toolbar.
 -
Hover the mouse pointer over the needed data point.
-
All the graphs will show the values of all their counters for the data point.
To view the minimum or maximum value of a counter at a specific moment of the test run:
-
Click
 Show the Range of Values on the page toolbar. The graph will show the range between the minimum and maximum values as a colored area.
Note: If the minimum, maximum, and average values are the same, the graph will not show the range between the minimum and maximum values. It will show only the average values.
-
Hover the mouse pointer over the lower or upper bound of the range area at the needed data point.
-
The graph will show the minimum or maximum value of the counter for that data point.
To view or hide axes titles
Click  Show Axes Titles on the panel toolbar. If the toolbar is hidden, click
  on the panel to expand the toolbar.
To view or hide the list of available counters
Each graph can plot several series of counter values. The list of available counters (or legend) is in the right part of the page.
You can hide the list to free some space for the graph area.
To view or hide the list, click  Show Counter List on the panel toolbar. If the toolbar is hidden, click
  on the panel to expand the toolbar.
To scroll a graph
To scroll a graph, use the scroll bar at the bottom of the page.
| Note: | If the graphs are configured to fit the page width, the scroll bar is hidden, and the graph width always matches the page width. |
To make the page automatically scroll the graphs to the last data point of the test run (the rightmost point), click  Auto scroll on the page toolbar.
To create a new view
-
Configure the graphs as you need: specify the counters to show and their color, specify how the page should show the graphs, their position, axes, and so on.
-
The page will show the current view as <Unsaved>. Click
 Save on the panel toolbar. If the toolbar is collapsed, click
  to expand it.
 -
In the resulting dialog, enter the view name, and then click OK. LoadComplete will save the view.
 You cannot overwrite the default views.
The created view will be available for all LoadComplete projects.
To select a view
Select the needed view from the View drop-down list.
To delete a view
-
Select the view you want to delete from the View drop-down list.
-
Click
 Delete on the panel toolbar. If the needed toolbar command is hidden, click
  to expand the toolbar.
 You can delete only custom views.
To save or discard the changes
If there are unsaved changes on the page, the View list will show your current view as <Unsaved>. Click  Save and specify a name for your view.
To discard the unsaved changes, select any other view from the View drop-down list.
More Information on Performance Monitoring
|
To learn more |
See the following topics |
|---|---|
|
Measuring client-side performance of web applications and websites |
|
|
Measuring server-side performance of web applications and websites |
|
|
Preparing web servers for monitoring |
|
|
Common load testing tasks |

