About
LoadComplete can track various performance parameters of the tested web server, such as CPU load, memory and disk usage, the number of errors and so on.
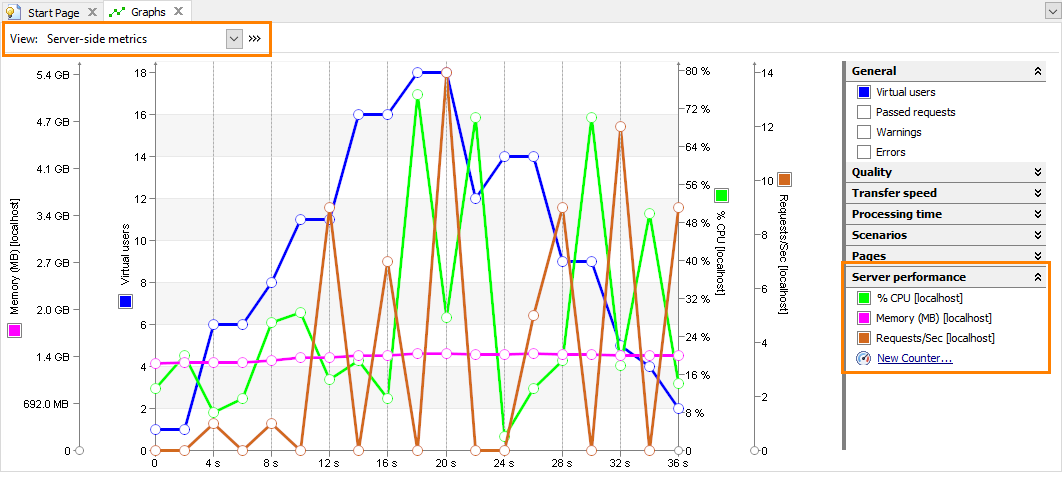
During the test run, LoadComplete shows these parameters as graphs on the Runtime > Graphs page of the project. It plots them in real time:
Monitoring the server performance will help you estimate the load test efficiency and can pinpoint the cause of the server unproductiveness.
The monitored parameters are called counters.
Supported Servers and Counter Types
LoadComplete can retrieve performance data from Windows-based, Unix-based, or Apache servers, and from Oracle databases. What counters are available depends on the server type:
Adding Performance Counters
Add and configure performance counters before running your tests:
-
 Important: Configure the server to allow LoadComplete to access the needed performance data. See Preparing Servers for Monitoring.
To monitor an Oracle database, install Oracle Data Access Components on your current computer (the one from which you will control the test run). See Requirements for Monitoring Oracle Databases.
-
Specify the servers you want to monitor and add performance counters:
-
On the Counters page, click
 Add Counter on the page toolbar.
– or –
On the Runtime > Graphs page, expand the Server performance group of the counter list and click the
 New Counter link.
 -
Follow the instructions of the resulting Add Counter wizard: specify the server to monitor, select providers that will retrieve data on the server performance, and select the needed performance counters.
-
Enable the added counters on the Runtime > Graphs page.
-
For more information on working with counters, see Managing Server-Side Performance Counters.
Tutorial
Follow this tutorial to learn how to work with counters:
See Also
Server Monitoring
Monitoring Performance Graphs
Preparing Servers for Monitoring
Managing Server-Side Performance Counters


