
Now we are going to isolate routines that sufficiently impact application performance. We will assume that if a routine call takes more than 5% of the total execution time, it does indeed impact the application’s performance. You can display these routines using filters or AQTime result views, which include filter settings.
Let’s define a filter condition to display time-expensive routines.
- Right-click somewhere within the Report panel and select
 Filter from the context menu.
 - In the resulting Filter dialog, click press the button to add a new condition.
- Select % with Children from the drop-down list of columns, then select "is greater than" from the drop-down list of comparison operators and enter 5 in the edit box.
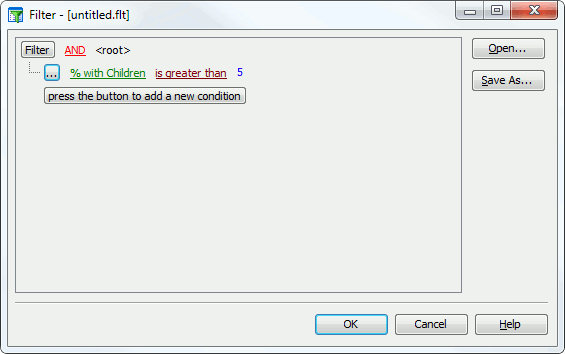
- Press OK to apply the filter. AQTime will filter results. The Report panel will only include routines that take more than 5% of the total time to execute. Here is what we got for a managed implementation of the Cycles application:

Click the image to enlarge it.

Click the image to enlarge it.
For an unmanaged implementation of our sample application we obtained results like the following:
Click the image to enlarge it.

Click the image to enlarge it.

Click the image to enlarge it.

Click the image to enlarge it.
Generally, in our test example the following methods are displayed: ProfilingTest, DoActionC, DoActionB, DoActionA and a method that is a handler of pressing the Execute button in the sample application (the name of this method depends on the language-specific implementation of the sample, for instance, in the Visual Basic app, this method is called ProfilingForm.Command1_Click, while in the C# app, it is called Form1.executeButton_Click). You can consider all of them as possible problem areas that are ready for optimization.
In addition to filters, you can use views to display the slowest routines in the Report panel. AQTime offers several predefined views for the Performance Profiler. To apply a view, select it from the Result Views drop-down list box on the Standard toolbarselect Result Views from Visual Studio’s AQTime menu, choose the desired view in the resulting Views dialog and click OKclick the Result Views button (by default, this button is hidden, but you can enable it via the Customize dialog), choose the desired view in the resulting Views dialog and click OK. See Result Views.
 Prev
Prev
See Also
Performance Profiler
Filtering Results
Grouping Results
Searching Results
Sorting Results