Review the profiling results in the Report panel. To find the routines that substantially influence application performance, review the %Time and % with Children columns. For time-critical applications, you can analyze the Time and Time with Children columns that report the execution time of a routine (the measurement unit - seconds, milliseconds, microseconds or machine cycles - can be selected on the toolbar). If you are interested in timing results of the first call to each routine, review the First Time and First Time with Children columns. You can sort results on the appropriate column(s): just click the desired column header.
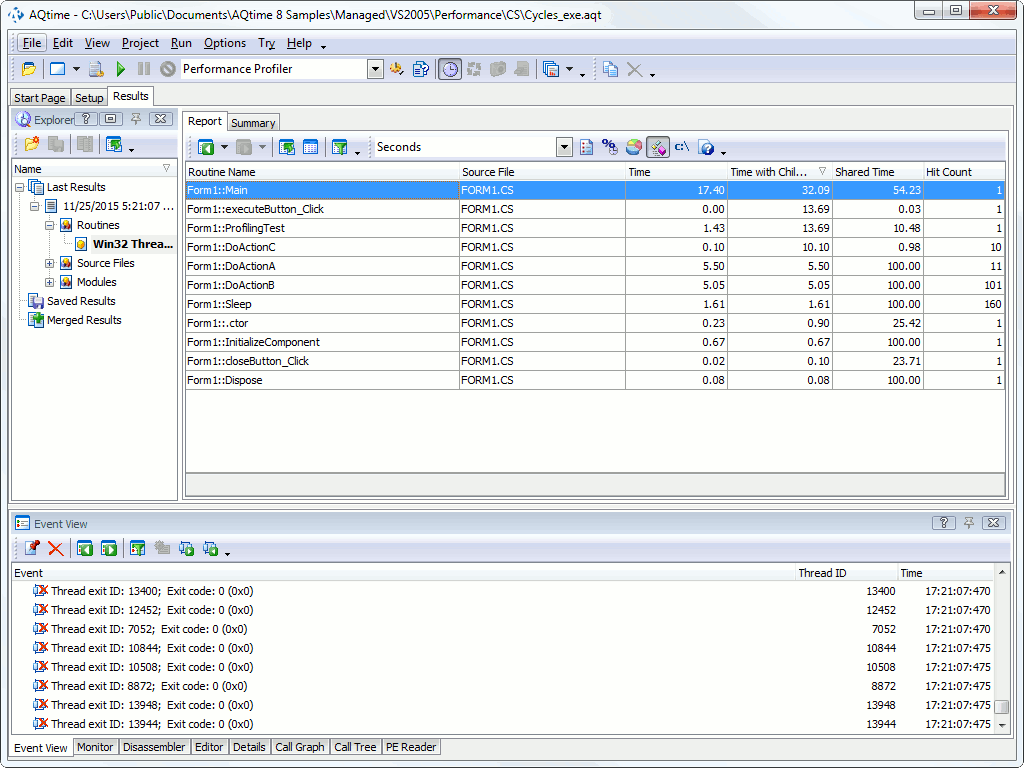
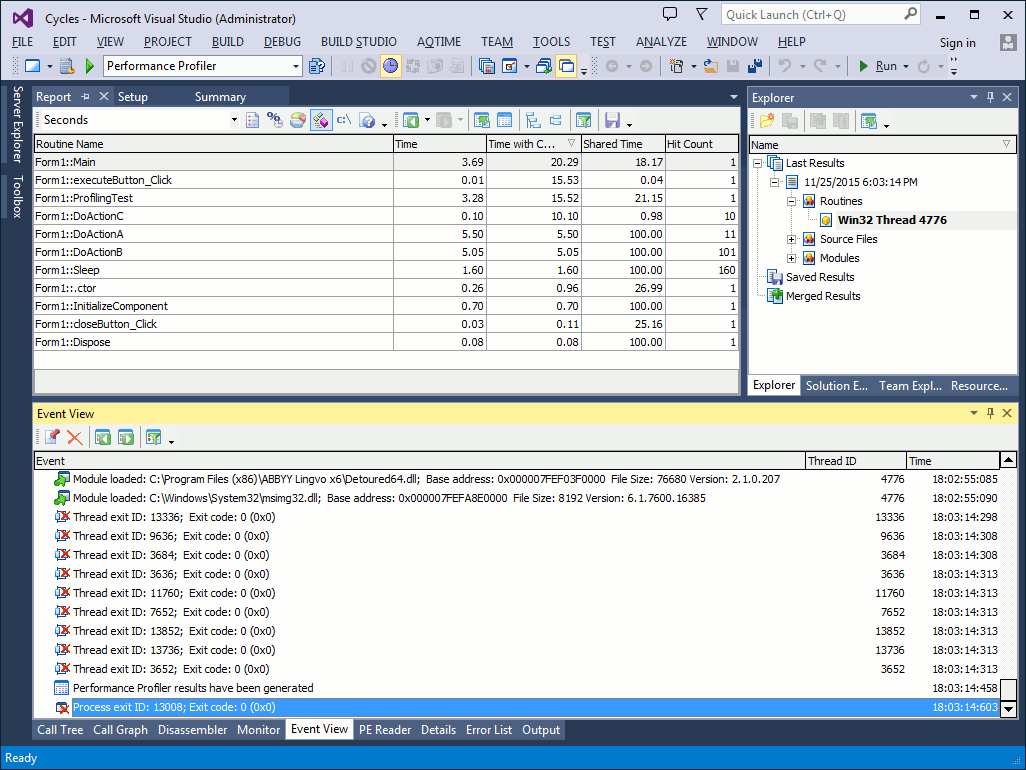
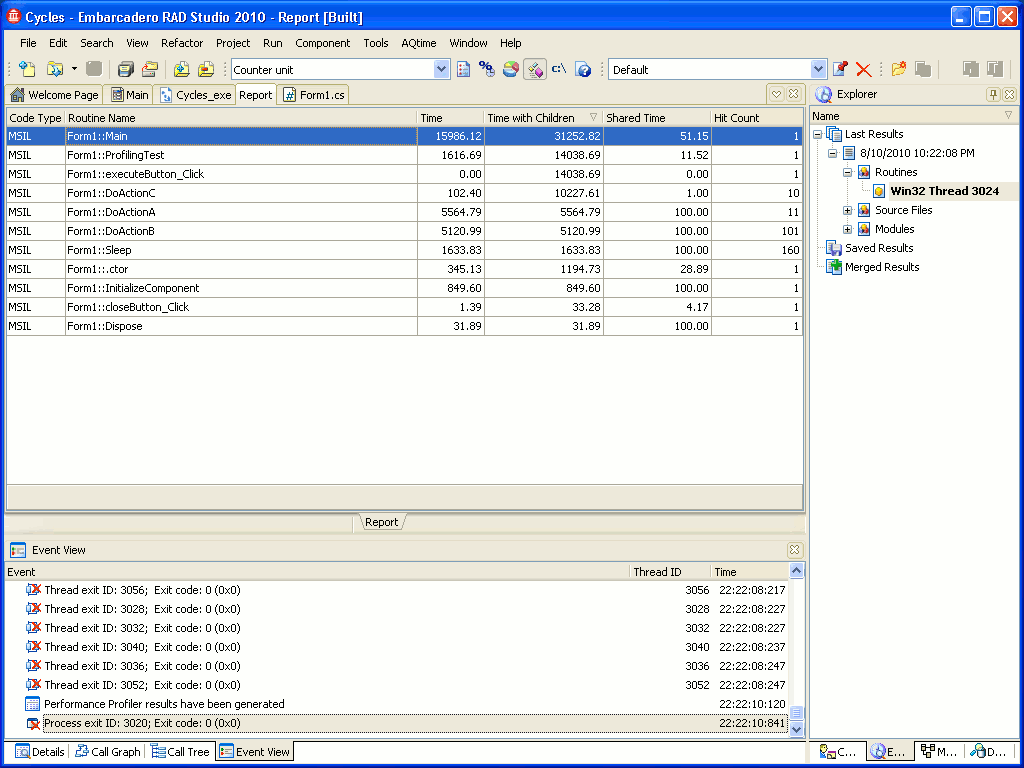
Here is a sample display of profiling results for a managed implementation of the Cycles application:
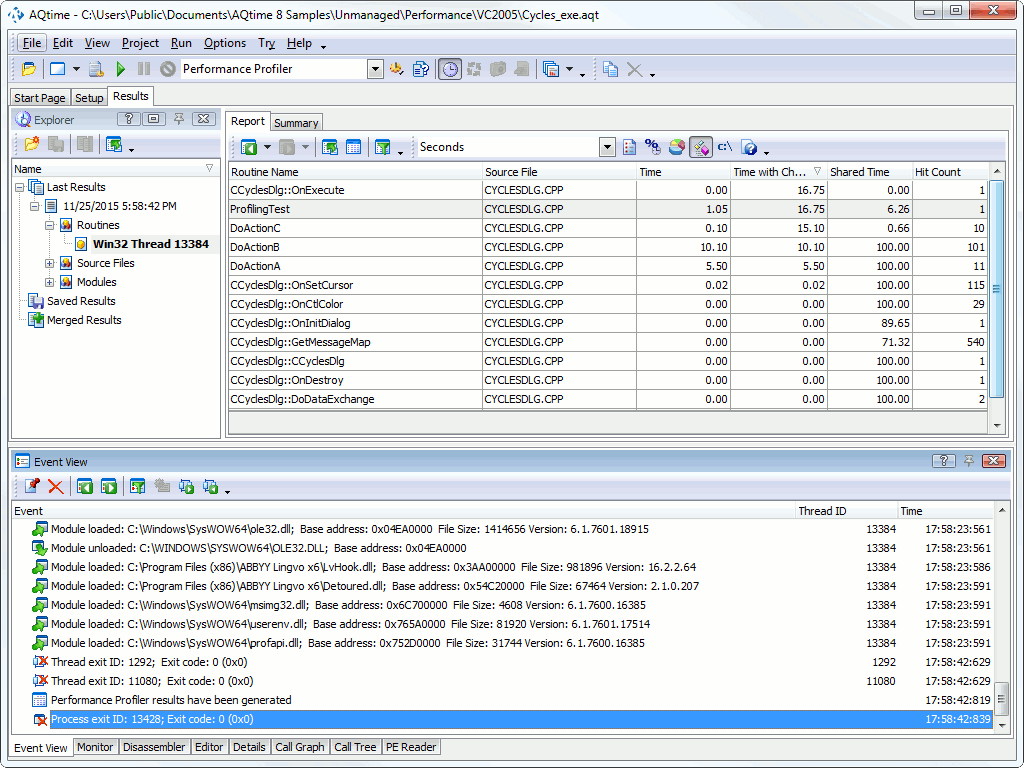
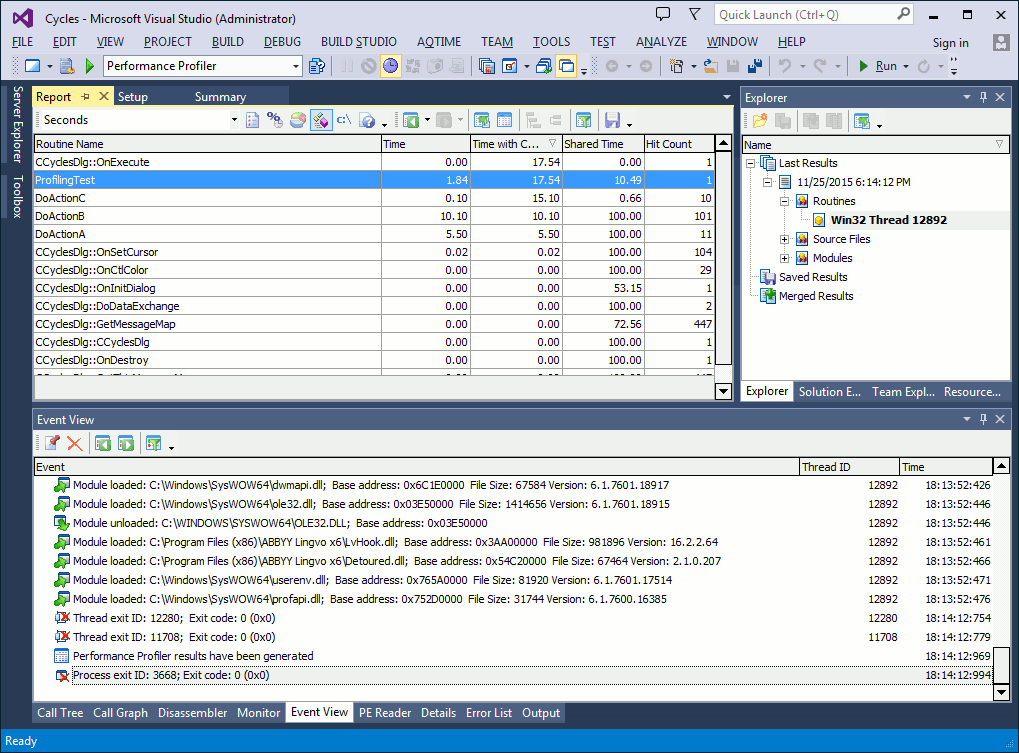
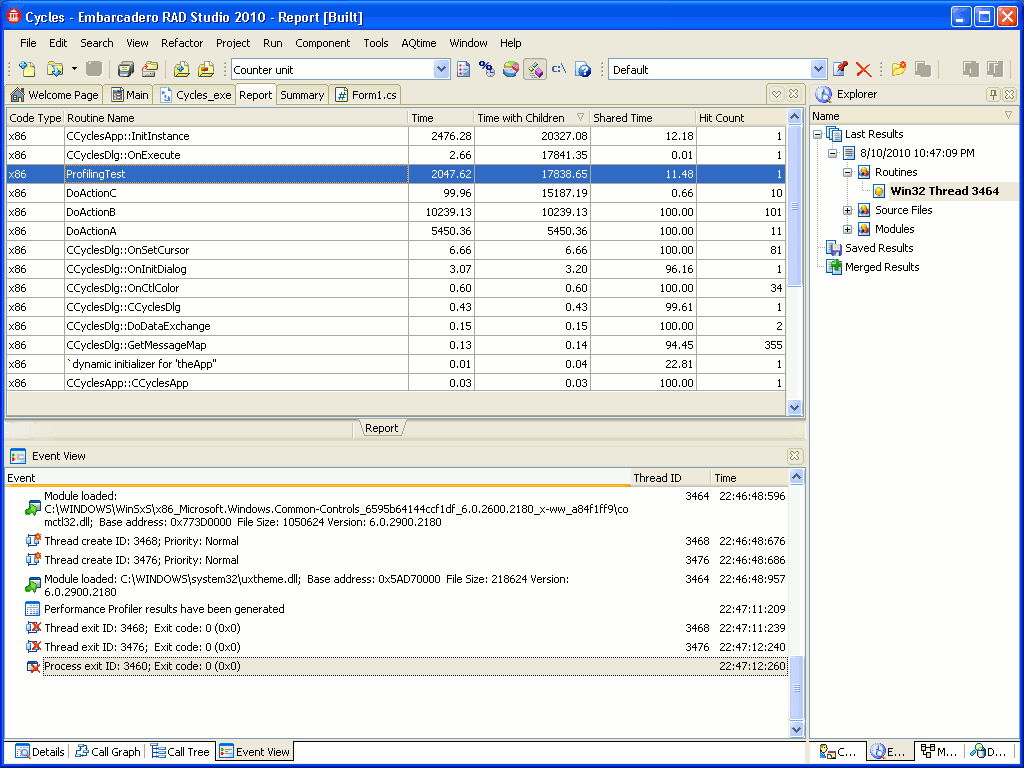
For an unmanaged implementation of the sample, we can get profiling results like the following:
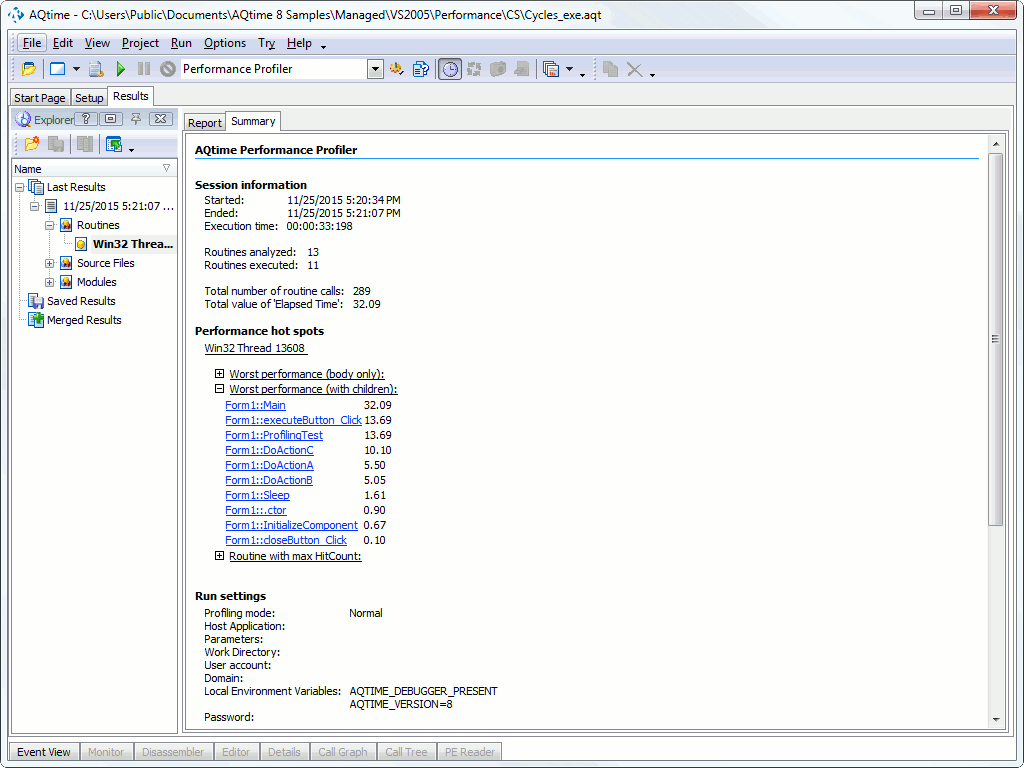
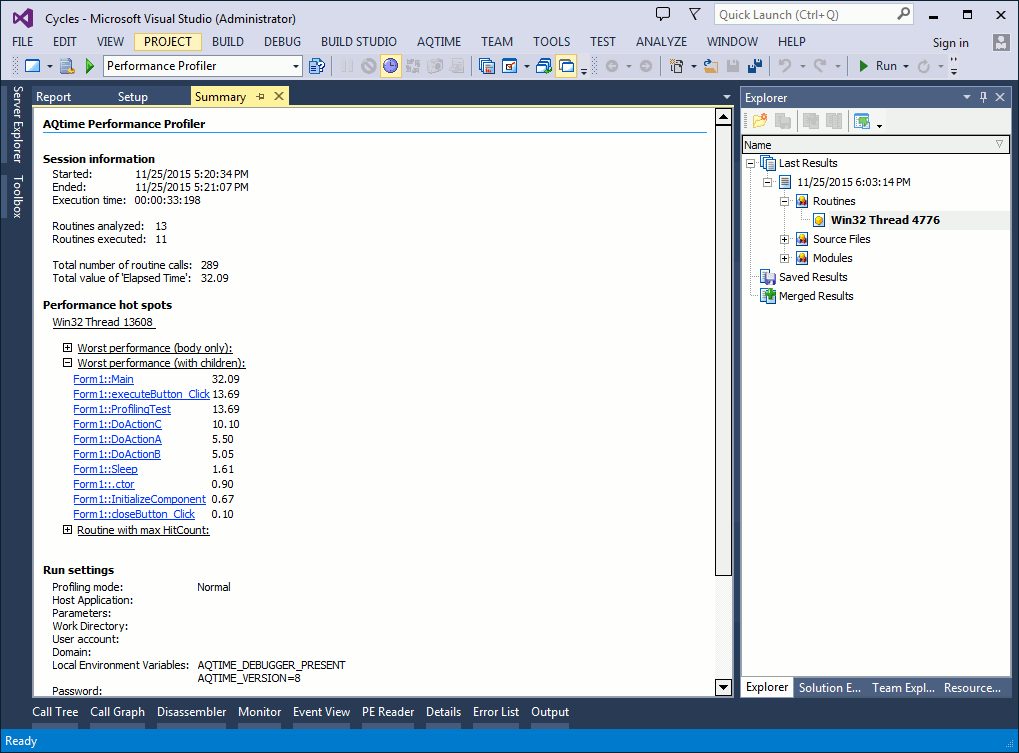
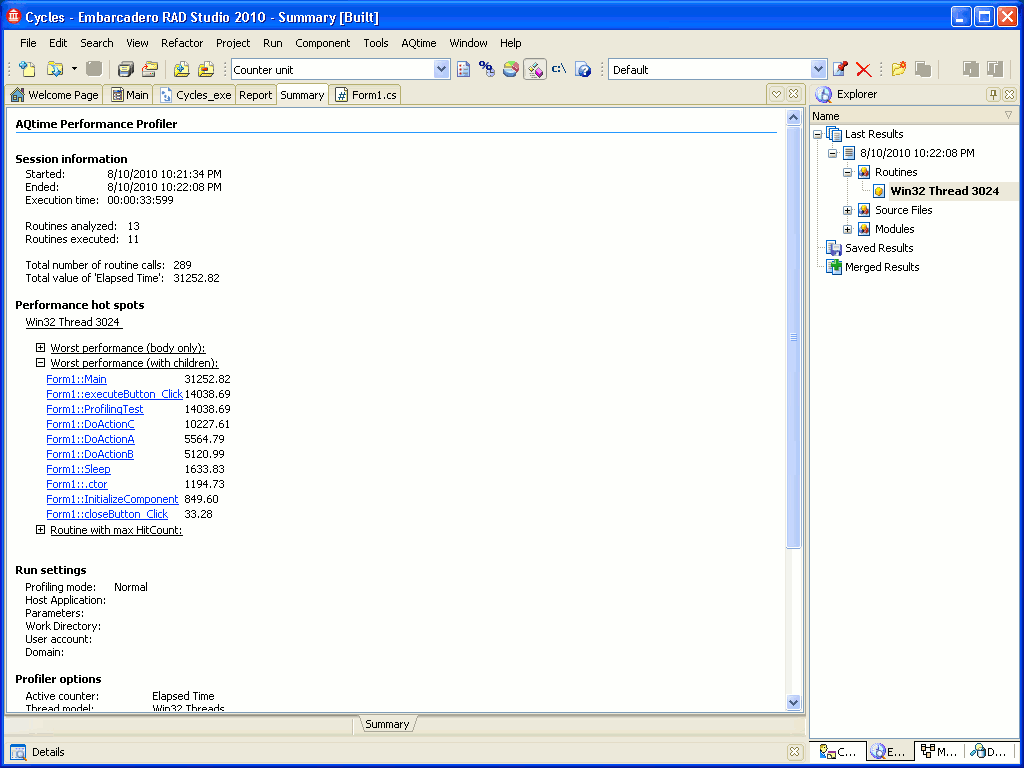
If we take a look at the Summary panel, we will see some kind of the summarized analysis, which AQTime made for us:
At the next step you will learn how to filter profiling results.

 Prev
Prev