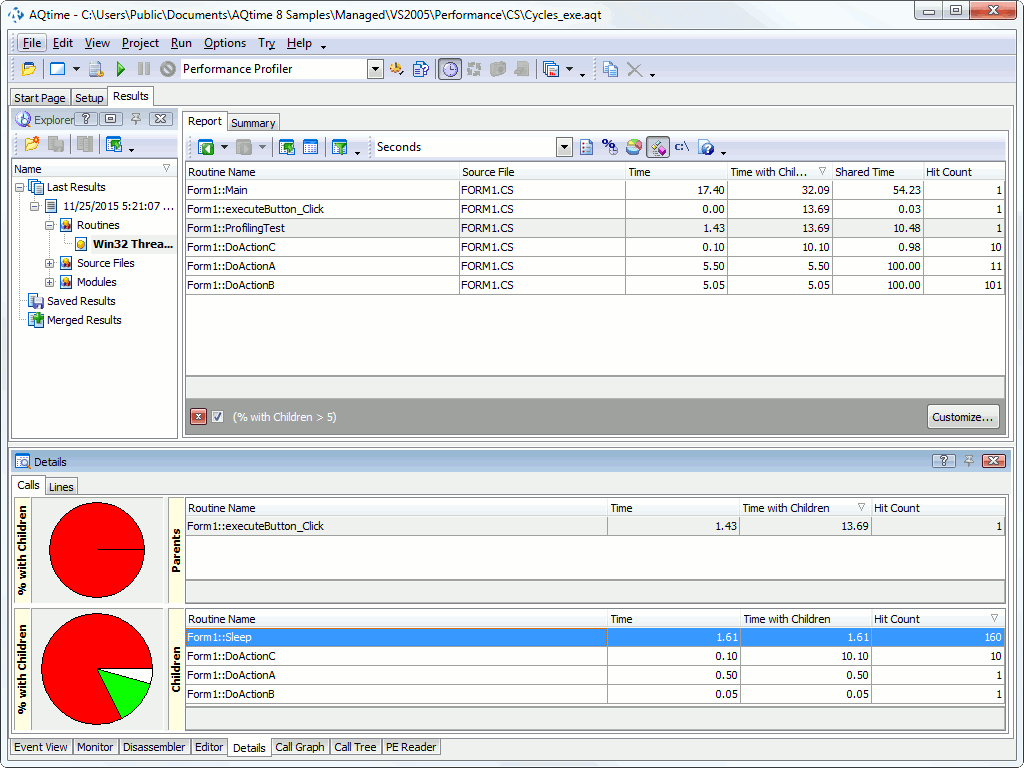
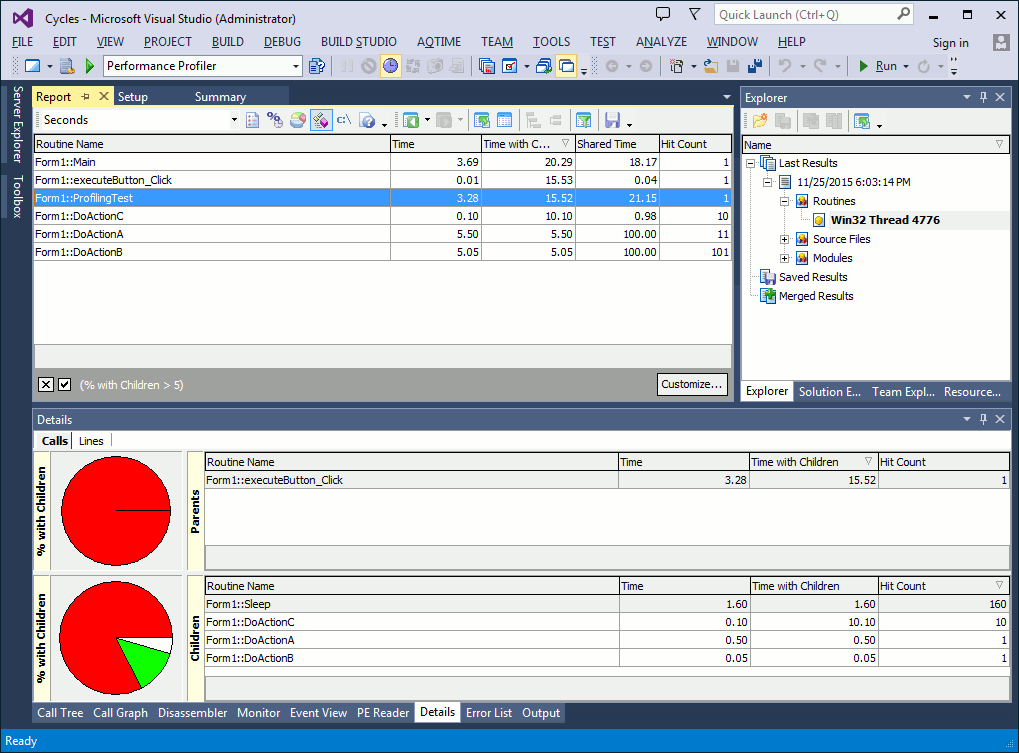
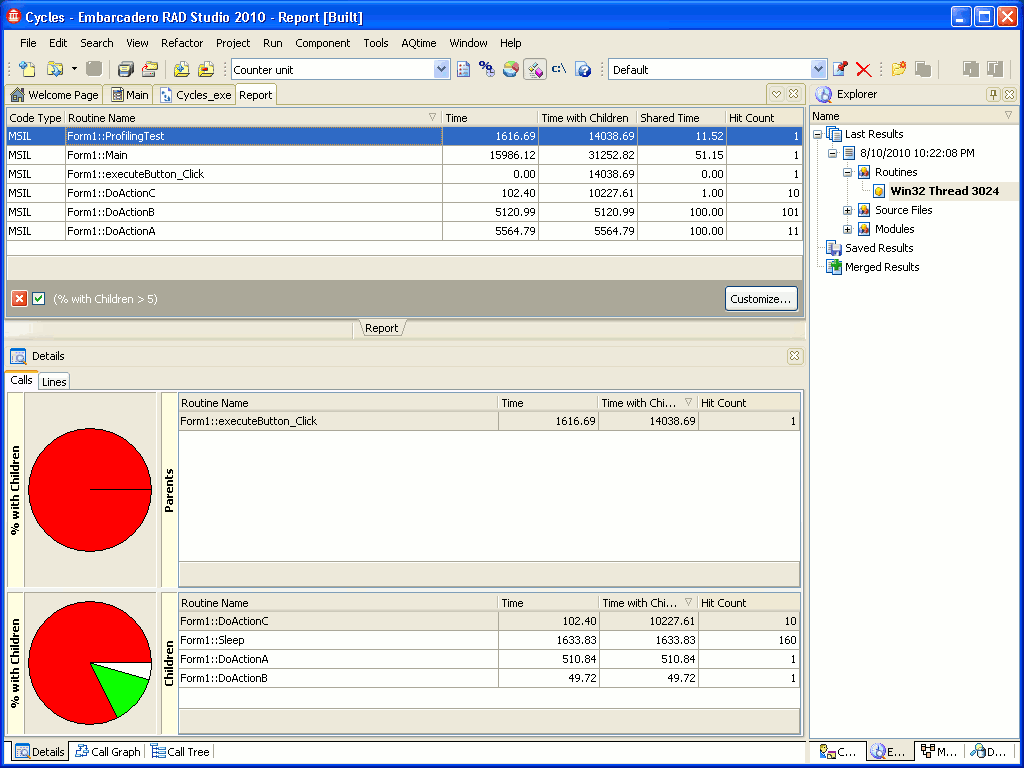
In our test example, we clearly have bottlenecks in our code. Take a look at the ProfilingTest routine, for instance, in the C# implementation of the Cycles sample. It was called only once and took about 20% of the total time. Let’s analyze its profiling results: click the routine in the Report panel and switch to Details:
The Parents pane displays all parent routines of ProfilingTest, that is, the list of routines that call ProfilingTest. In the bottom section of the pane there are child routines of ProfilingTest. For a better comparative analysis, you can enable the Include routine body in Details option of the Performance profiler (to do this, press  on AQTime’s Profiler toolbar on the Profiler toolbar that is displayed within the Report panel on the Profiler toolbar that is displayed within the Report panel).
If this option is on, AQTime displays the net routine results (for the routine’s own code, minus child calls) in the Children pane.
Note that the Calls page only displays routines that were actually executed during the run. These can vary from one run to another. For instance, routine A can call routine B when X < Y. During the profiling process if this condition was never met (X>Y), then routine B is never called from routine A. So, routine B will not be displayed in the Details panel as a child of routine A.
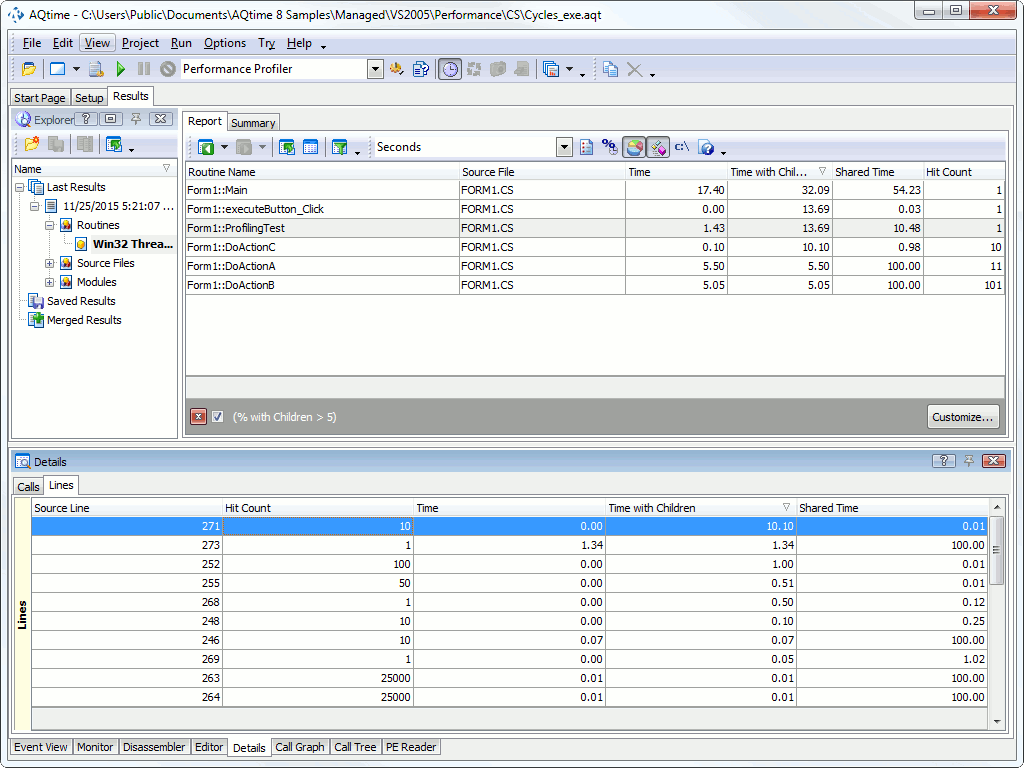
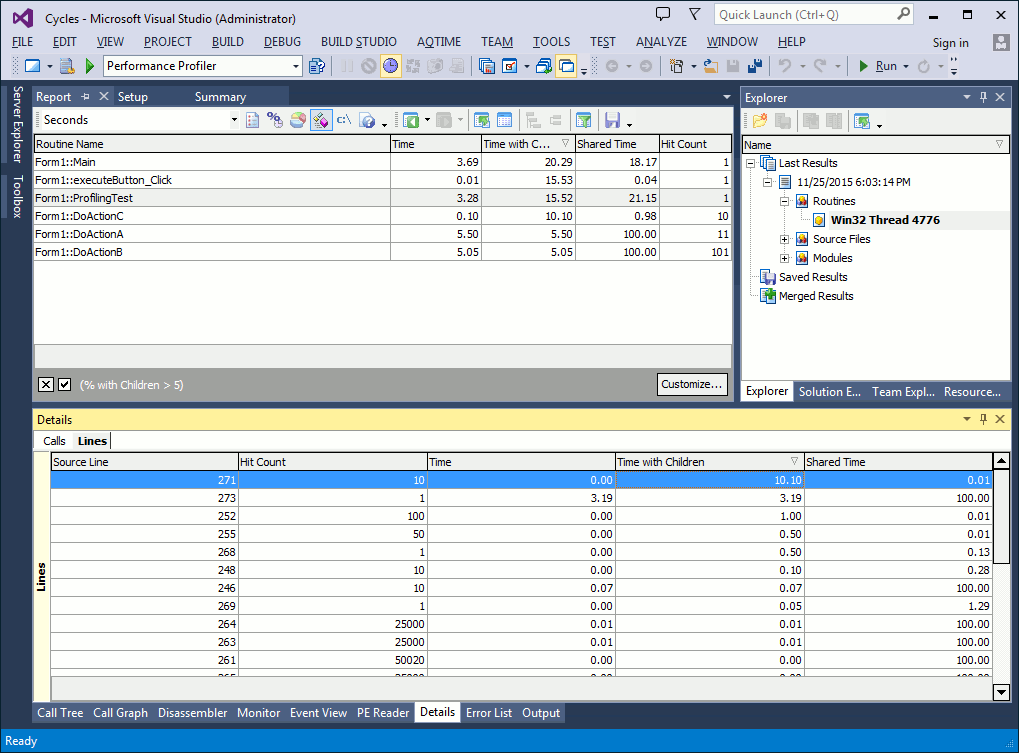
As you can see, the slowest child routine of ProfilingTest is DoActionC. We will analyze it in the next step. Now let’s continue with ProfilingTest. To see how its execution time is distributed among lines of source code, open the Lines pane of the Details panel. This pane displays the results of line profiling for routines included in the line level areas. Remember that before launching the profiler, we had added ProfilingTest to a line level area.
Note that line level profiling is only available if the application was compiled with the debug information (see How AQTime Profilers Use Metadata and Debug Information).
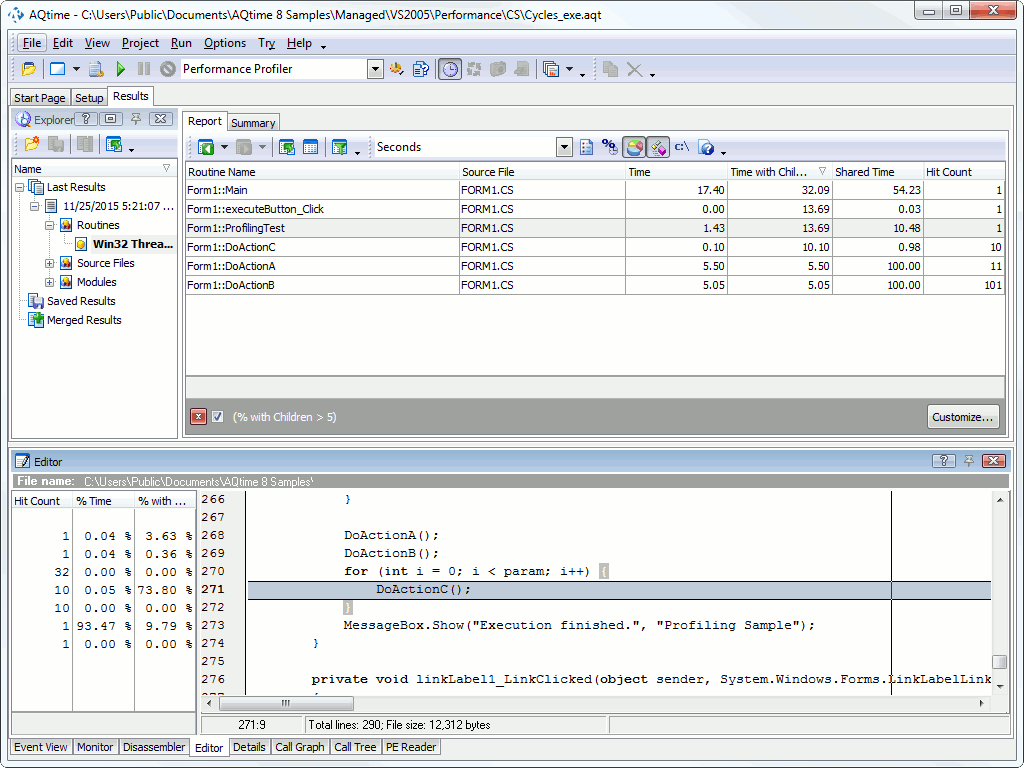
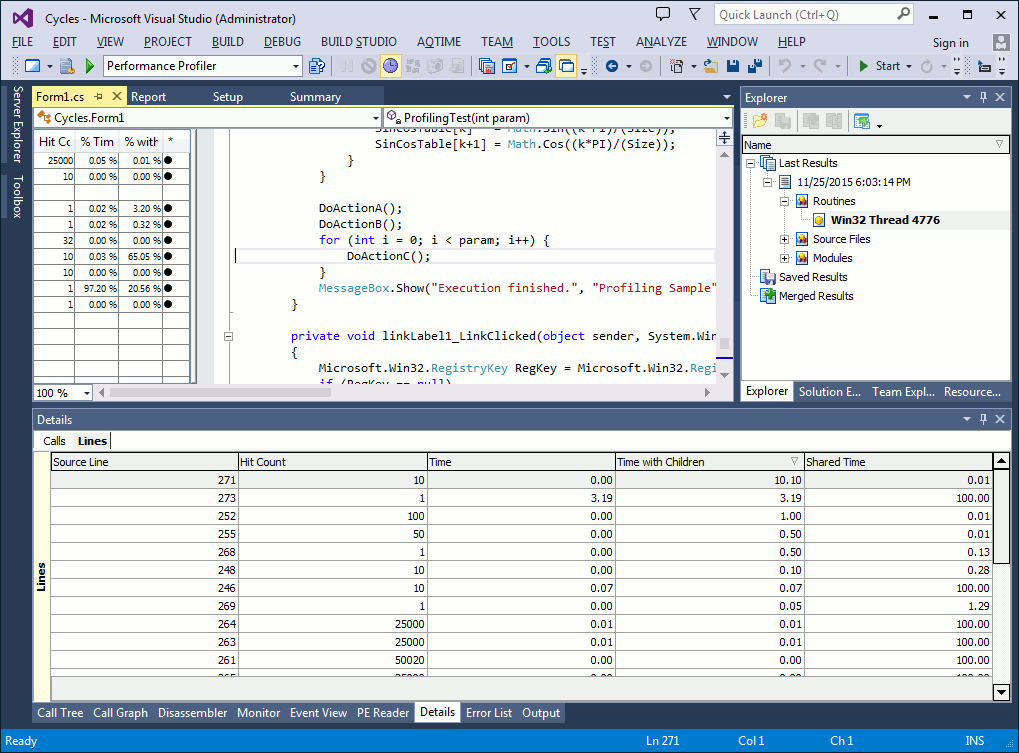
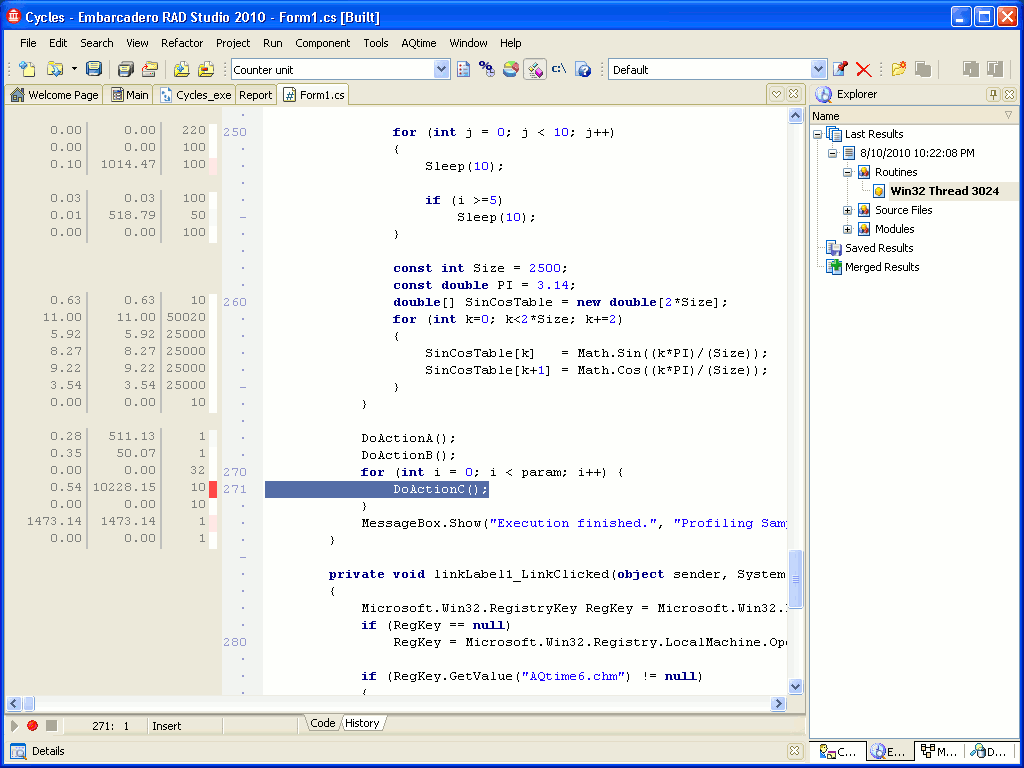
Line #271Line #271Line #267 took the longest time to execute (the actual line number depends on the language-specific implementation of the sample). To see the actual contents of this line, switch to the Editor panelswitch to Embarcadero RAD Studio’s Editorselect the ProfilingTest record in Report, select Show Source File from the Edit menu and switch to Visual Studio’s Code Editor. (The link to the source code is available only if your application was compiled with debug information. See How AQTime Profilers Use Metadata and Debug Information. In addition, path to source files must be specified in the Project Search Directories or Search Directory dialog.)
 |
The Code Editor of Visual Studio lets you collapse and expand blocks of source code. The grid, which AQTime adds to the Code Editor to display profiling results, supports neither collapsing, nor expanding, because Visual Studio does not send appropriate notifications to AQTime. So, to ensure that the grid shows proper profiling results for source lines and routines, please expand all the collapsed blocks of code. To do this, use the Outlining > Toggle All Outlining or Outlining > Stop Outlining item of the Code Editor’s context menu. |
 |
The Editor of Embarcadero RAD Studio lets you collapse and expand blocks of source code. The grid, which AQTime adds to the Editor to display profiling results, supports neither collapsing, nor expanding, because Embarcadero RAD Studio does not send appropriate notifications to AQTime. So, to ensure that the grid shows proper profiling results for source lines and routines, please expand all the collapsed blocks of code. To do this, use the Unfold > All item of the Editor’s context menu. |
The editor’s grid displays the execution time next to each source line. Line #271Line #271Line #267 holds a call to the DoActionC routine. This confirms what we have seen in the Details panel: DoActionC is the slowest child routine of ProfilingTest.
Note that one of the slowest lines is one with a call to the MessageBox function. In our example it took about 222.5 seconds. Of course, this does not mean that MessageBox took 222.5 seconds to draw the window and text on screen. Included in the 222.5 seconds is the time it waited for a user to close the message window.


 Prev
Prev