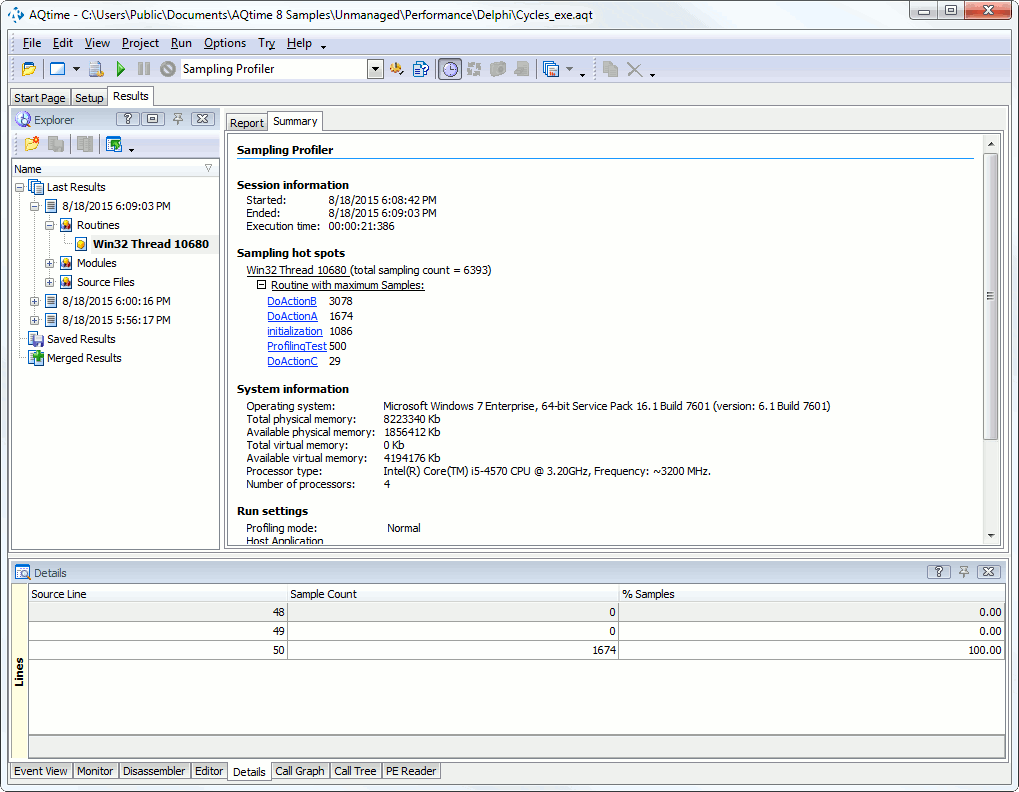
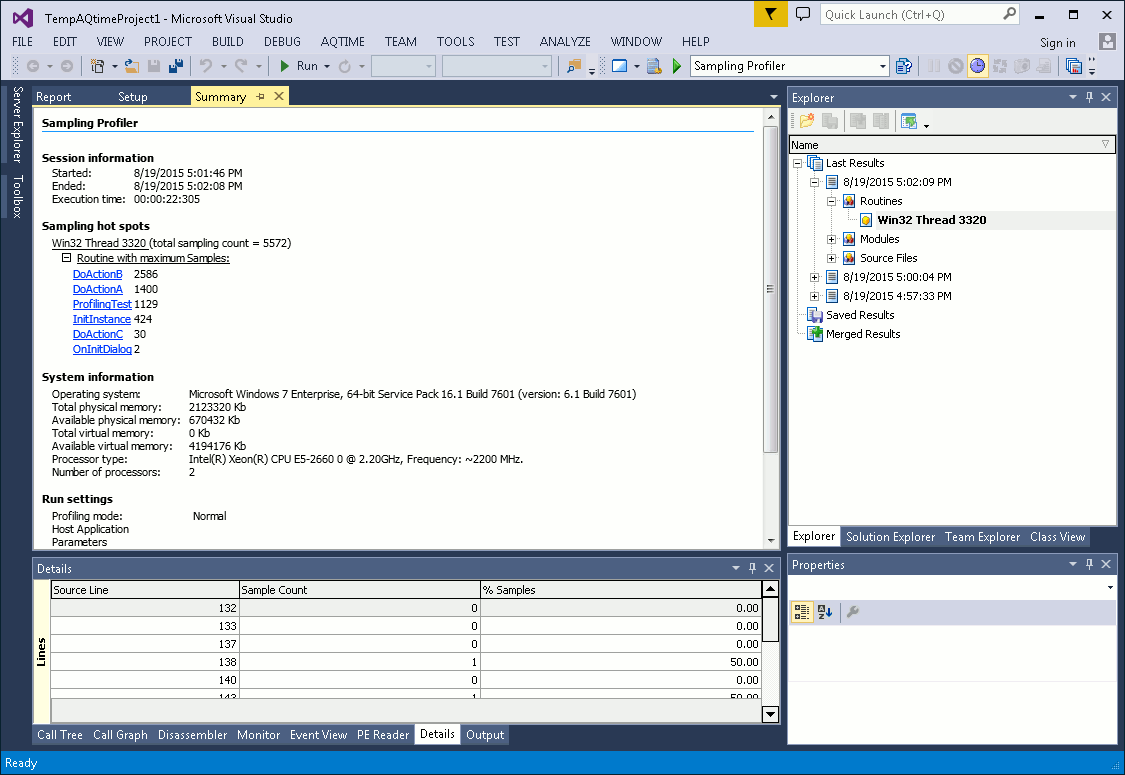
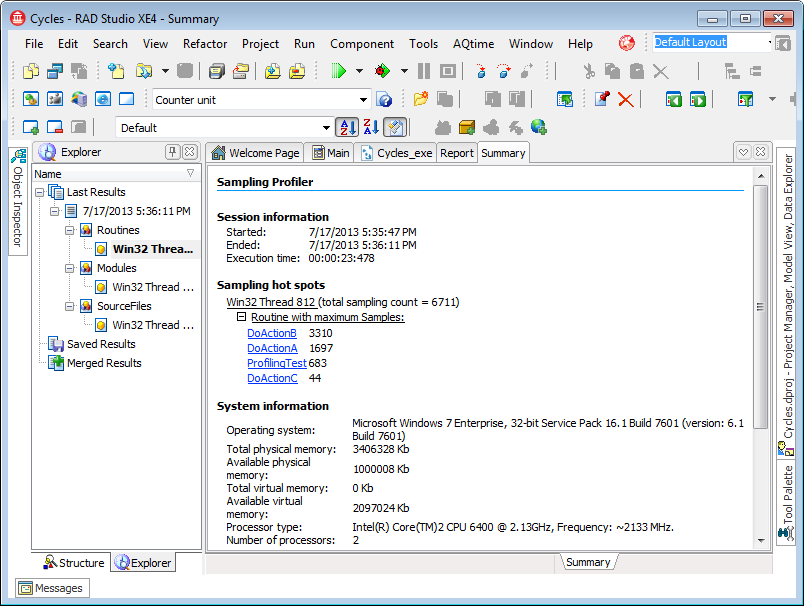
The Sampling profiler generates results after the profiling is over, or when you select  Get Results from the menu or on the toolbar. This topic provides an overview of profiling results and panels that display them.
Summary Profiling Results
The Summary panel displays summary results for the entire profiler run. It shows the total number of samples collected during profiling and the top ten routines with the maximum number of samples.
Detailed Results
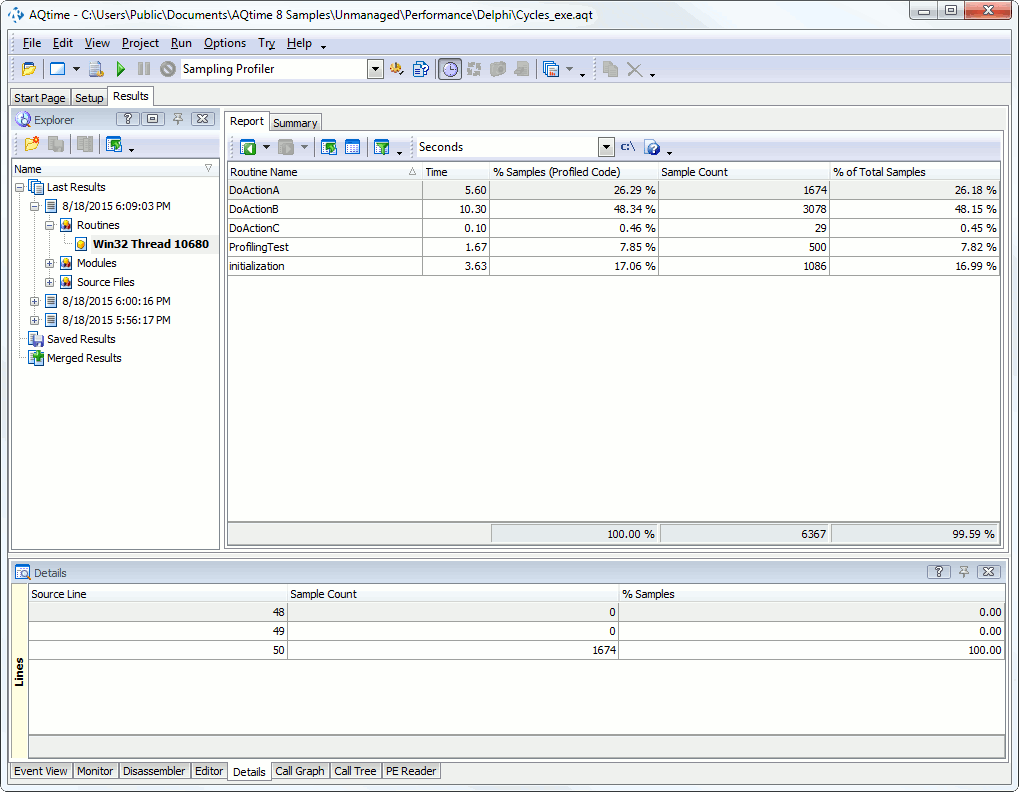
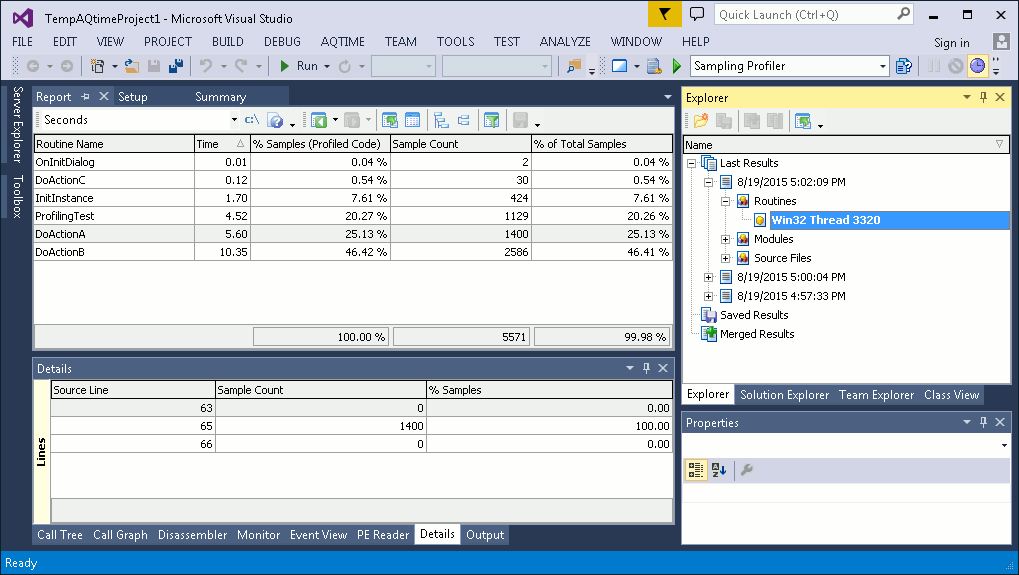
The Sampling profiler gathers results for individual routines and lines as well as for modules and source files. The results are displayed in the Report, Details, Explorer and other panels. Below is a sample output of the Sampling profiler:
The profiling results are organized into three categories: Routines, Source Files and Modules. You can see them in the Explorer panel (by default, it is on the left of AQTime's window). Source Files and Modules let you view summary profiling results for each source file and module in your application. The Routines category contains results for each routine that was included in profiling tasks.
Within the categories, the results are grouped by threads. There is also the All threads group that shows profiling results for all the threads. You can also select the desired category and thread from the Result Items box:
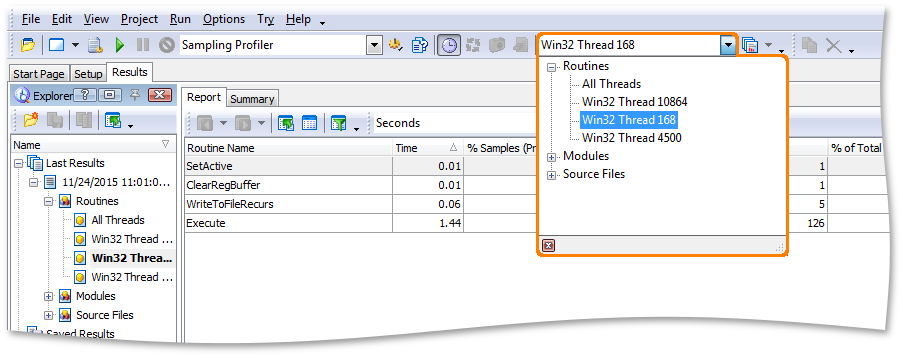
After you choose the desired category, AQTime will update the Report, Details and other panels. The contents of the panels depend on the selected category:
-
Routines
If this category is selected, the Report panel displays profiling results for each routine. Line results are displayed in the Details and Editor panels. in the Code Editor’s grid. in the Editor’s grid. The Report panel is the “main” results display.
Line-level results are shown only if the routine, class, file or module was added to a line-level profiling area. Otherwise, line-level results are not displayed.
For a detailed description of the results displayed under the Routines category, see Results of the Routines Category.
-
Source Files
If this category is selected, each row in the Report panel shows profiling results for a source file. The other panels that provide additional information on profiling results are not used.
For a detailed description of the results displayed in the Source Files category, see Results of the Source Files Category.
-
Modules
If this category is selected, each row in the Report panel displays profiling results for one application module. The other panels that provide additional information on profiling results are not used.
For a detailed description of the results displayed in the Modules category, see Results of the Modules Category.
By default, this item is hidden. To add it:
-
Right-click any AQTime toolbar and select Customize from the context menu.
-
In the Customize dialog, open the Commands tab and select the Standard category.
-
Drag the Result Items command to the desired toolbar and then close the dialog.
See Also
Sampling Profiler - Overview
Analyzing Profiler Results
Comparing Results
Merging Results

 Summary Profiling Results