
The Sampling profiler organizes results into three categories: Routines, Modules and Source Files. When the Routines category is active, AQTime displays profiling results collected for routines of the modules that are included in your AQTime project. If a routine was profiled at line level, you can also see profiling results for individual lines.
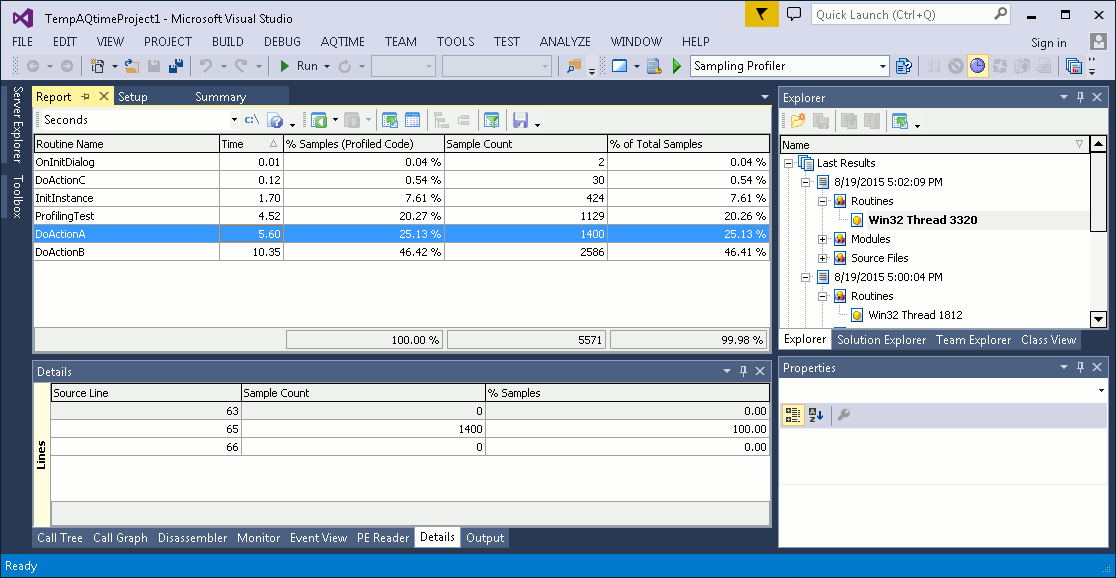
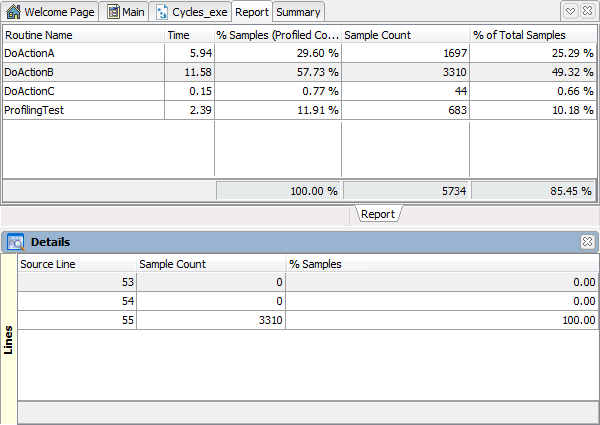
Below is a sample output of Sampling profiler results displayed in the Routines category:

Click the image to enlarge it.

Click the image to enlarge it.

Click the image to enlarge it.
The following sections describe what information you can get from profiling results.
 Viewing Profiling Results for Routines
Viewing Profiling Results for Routines
The Report panel displays profiling results for all the routines in your application. You can sort out the profiling results to find potential bottlenecks:
-
Sort out the results by the Time column to find out what routines take the most time during execution.
-
View the Sample Count column to find out the number of samples collected for the routine.
-
Check % Samples (Profiled Code) to find the most time-consuming and frequently-used routines.
Viewing Line-Level Profiling Results
If a routine was profiled at line level, you can view results collected for its lines. AQTime displays results in the Details and Editor panels.
Details Panel
To view line profiling results in the Details panel, double-click the desired routine in the Report panel and then switch to Details:
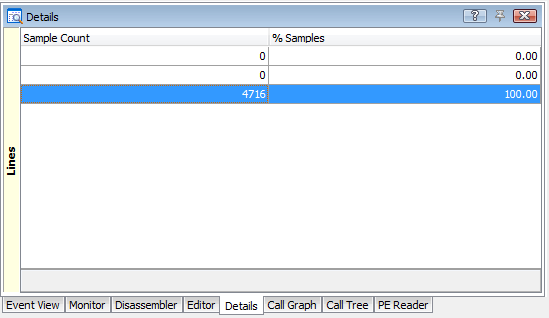
The Details panel is very similar to the Report panel. For instance, you can sort the profiling results by the Sample Count column to find the lines that got most samples.
To view the source code of a line, double-click the desired line and then switch to the Editor panel.
Editor Panel
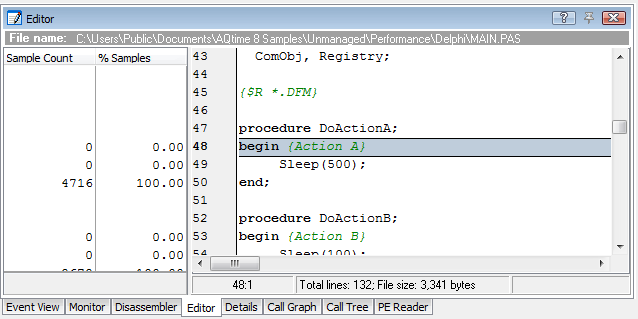
You can view line-level profiling results in the Editor panel. To do this, double-click a routine in the Report panel and then switch to the Editor. AQTime will position the cursor on the first source code line of the routine you clicked. The Editor gutter will display profiling results next to each source code line:
You can view line-level profiling results in the Code Editor. To do this, double-click a routine in the Report panel - the cursor will move to the source code line of the selected routine on the page that contains the application's source code. The Editor gutter will display profiling results next to each source code line:
You can view line-level profiling results in the Code Editor. To do this, double-click a routine in the Report panel - the cursor will move to the source code line of the selected routine on the page that contains the application's source code. The Editor gutter will display profiling results next to each source code line:
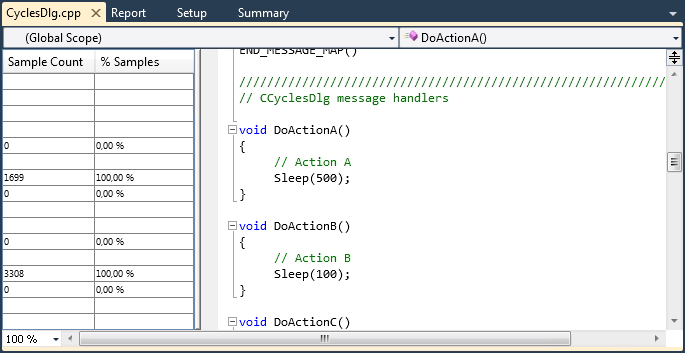
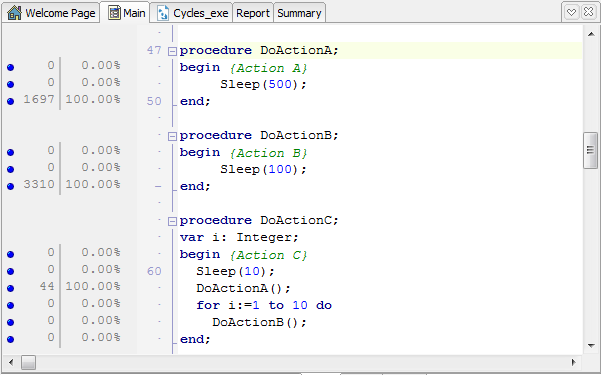
To select which columns to display in the gutter, right-click somewhere within the gutter and choose Field Chooser from the context menu. Then drag the desired columns from the subsequent list to the gutter. (See Adding and Removing Columns.)
AQTime displays the source code if the Project Search Directories or Search Directories setting specifies the path to the routine’s source file.
Line profiling results are available, of course, only if the routine was profiled at line level.
 |
The Code Editor of Visual Studio lets you collapse and expand blocks of source code. The grid, which AQTime adds to the Code Editor to display profiling results, supports neither collapsing, nor expanding, because Visual Studio does not send appropriate notifications to AQTime. So, to ensure that the grid shows proper profiling results for source lines and routines, please expand all the collapsed blocks of code. To do this, use the Outlining > Toggle All Outlining or Outlining > Stop Outlining item of the Code Editor’s context menu. |
|
The editor of Embarcadero RAD Studio lets you collapse and expand blocks of source code. The grid, which AQTime adds to the editor to display profiling results, supports neither collapsing, nor expanding, because Embarcadero RAD Studio does not send appropriate notifications to AQTime. So, to ensure that the grid shows proper profiling results for source lines and routines, please expand all the collapsed blocks of code. To do this, use the Unfold > All item of the editor’s context menu. |