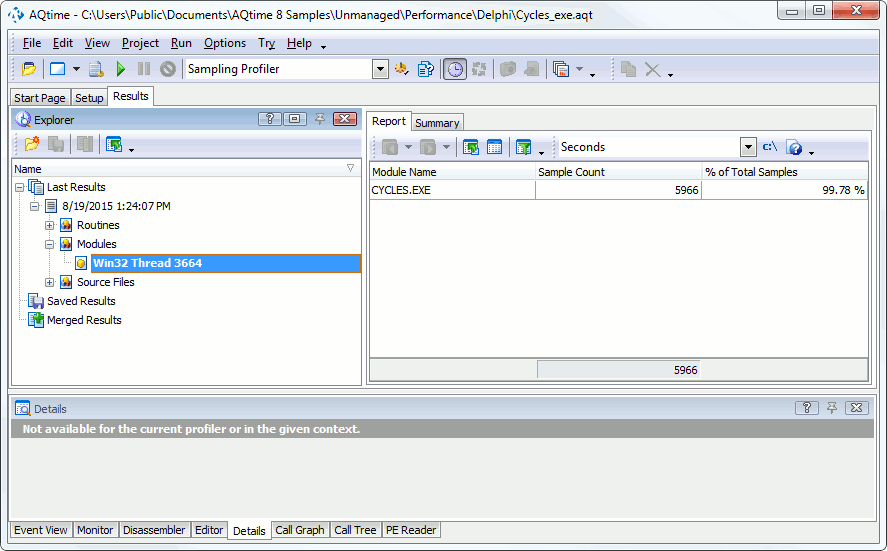
The Sampling profiler organizes results into three categories: Routines, Modules and Source Files. When the Modules category is active, AQTime displays profiling results collected for modules that are included in your AQTime project.
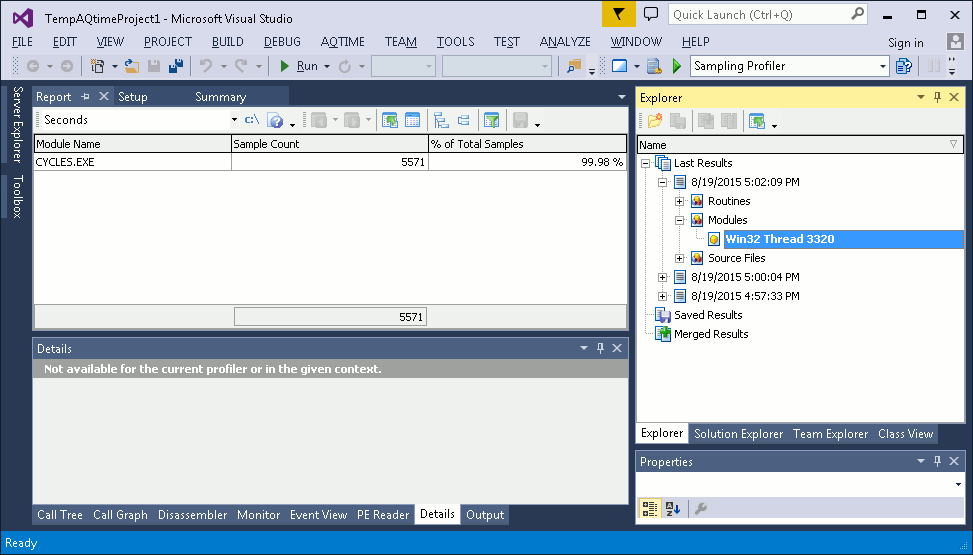
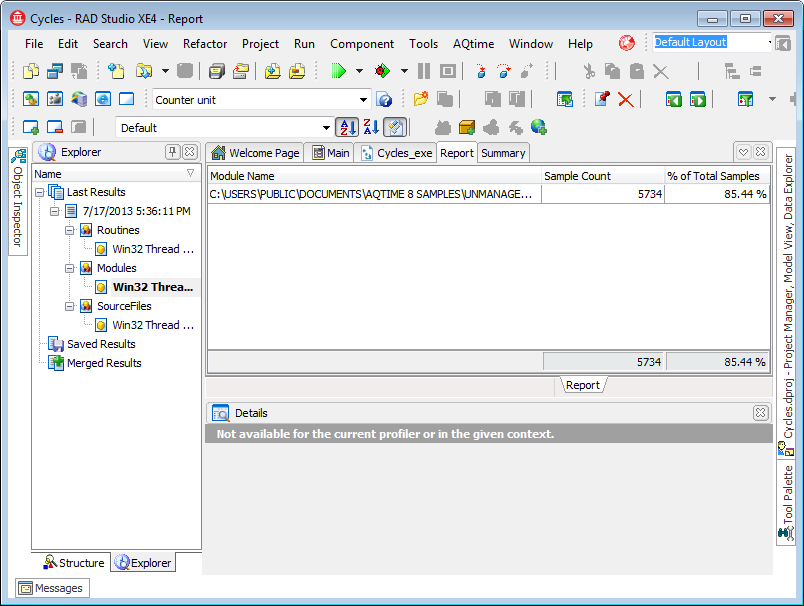
Below is a sample output of Sampling profiler results displayed in the Modules category:
Each row in the Report panel displays results for an individual module:
-
Module names are specified in the Module Name column.
-
The Sample Count column shows the total number of samples collected for the routines of the module.
-
The % of Total Samples column displays the number of samples collected for the module as a percentage of the total number of the samples collected during profiling. Note that this number can be less than 100% even if your project includes one module only. This happens because some samples were collected for code that does not belong to the module (for instance, they can be collected for some system code that was executed before any of the module’s functions).
For a detailed description of the available columns, see the Sampling Profiler Panels Reference.
See Also
Sampling Profiler - Overview
Analyzing Profiler Results
Comparing Results
Merging Results


