The Sampling profiler organizes results into three categories: Routines, Modules and Source Files. When the Source Files category is active, AQTime displays profiling results collected for the source files of the modules that are included in your AQTime project.
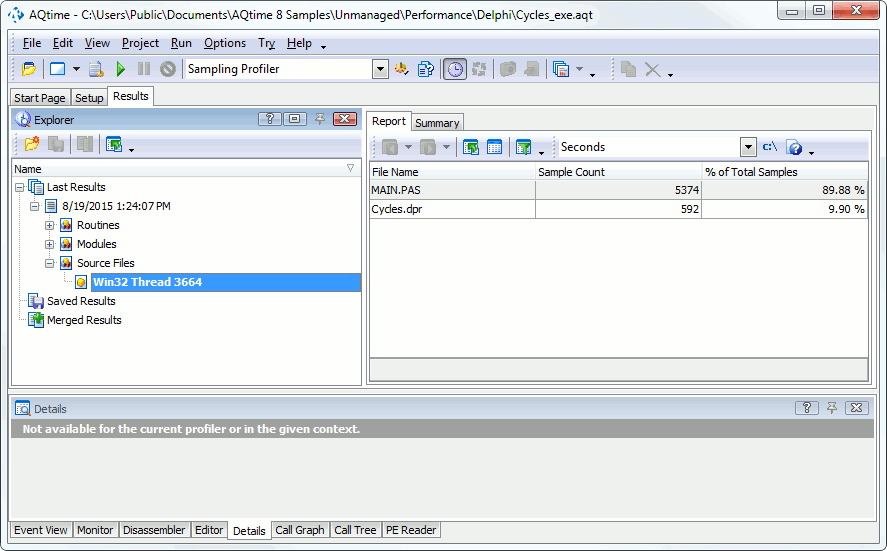
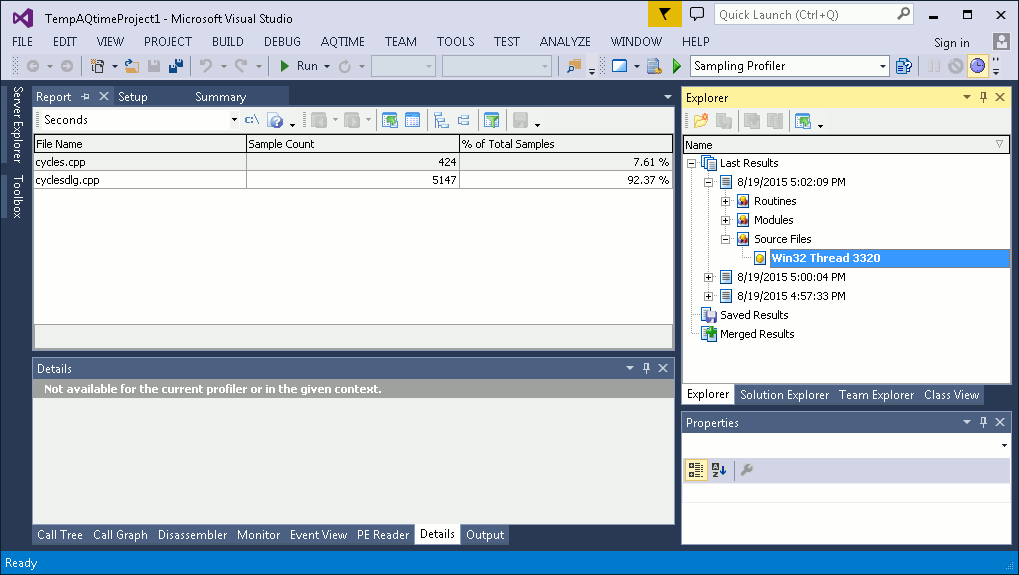
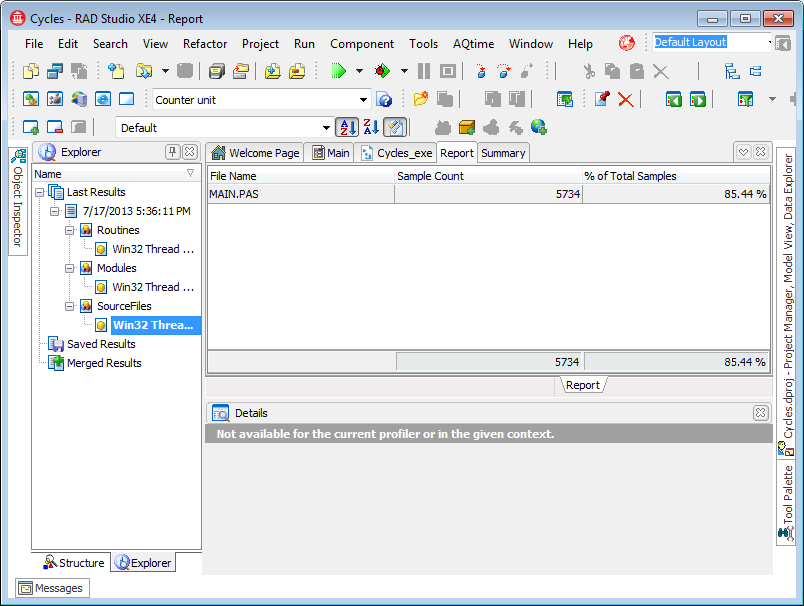
Below is sample output of Sampling profiler results displayed in the Source Files category:
Each row in the Report panel holds results for an individual source file:
-
Source file names are specified in the File Name column.
-
The Sample Count column shows the total number of samples collected for the routines that the source file contains.
-
The % of Total Samples column displays the number of samples collected for the source file, as a percentage of the total number of the samples collected during profiling. Note that the sum of values in this column can be less than 100% as there are samples collected for code that is not in the profiled modules (for instance, they can be collected for system code that is called before any function of the profiled application).
For a detailed description of the available columns, see the Sampling Profiler Panels Reference.


