Use the results screen to analyze the results of your test runs, check virtual users during active test runs, debug errors, and gather statistics.
Watch the video to learn how to analyze test results
Toolbar
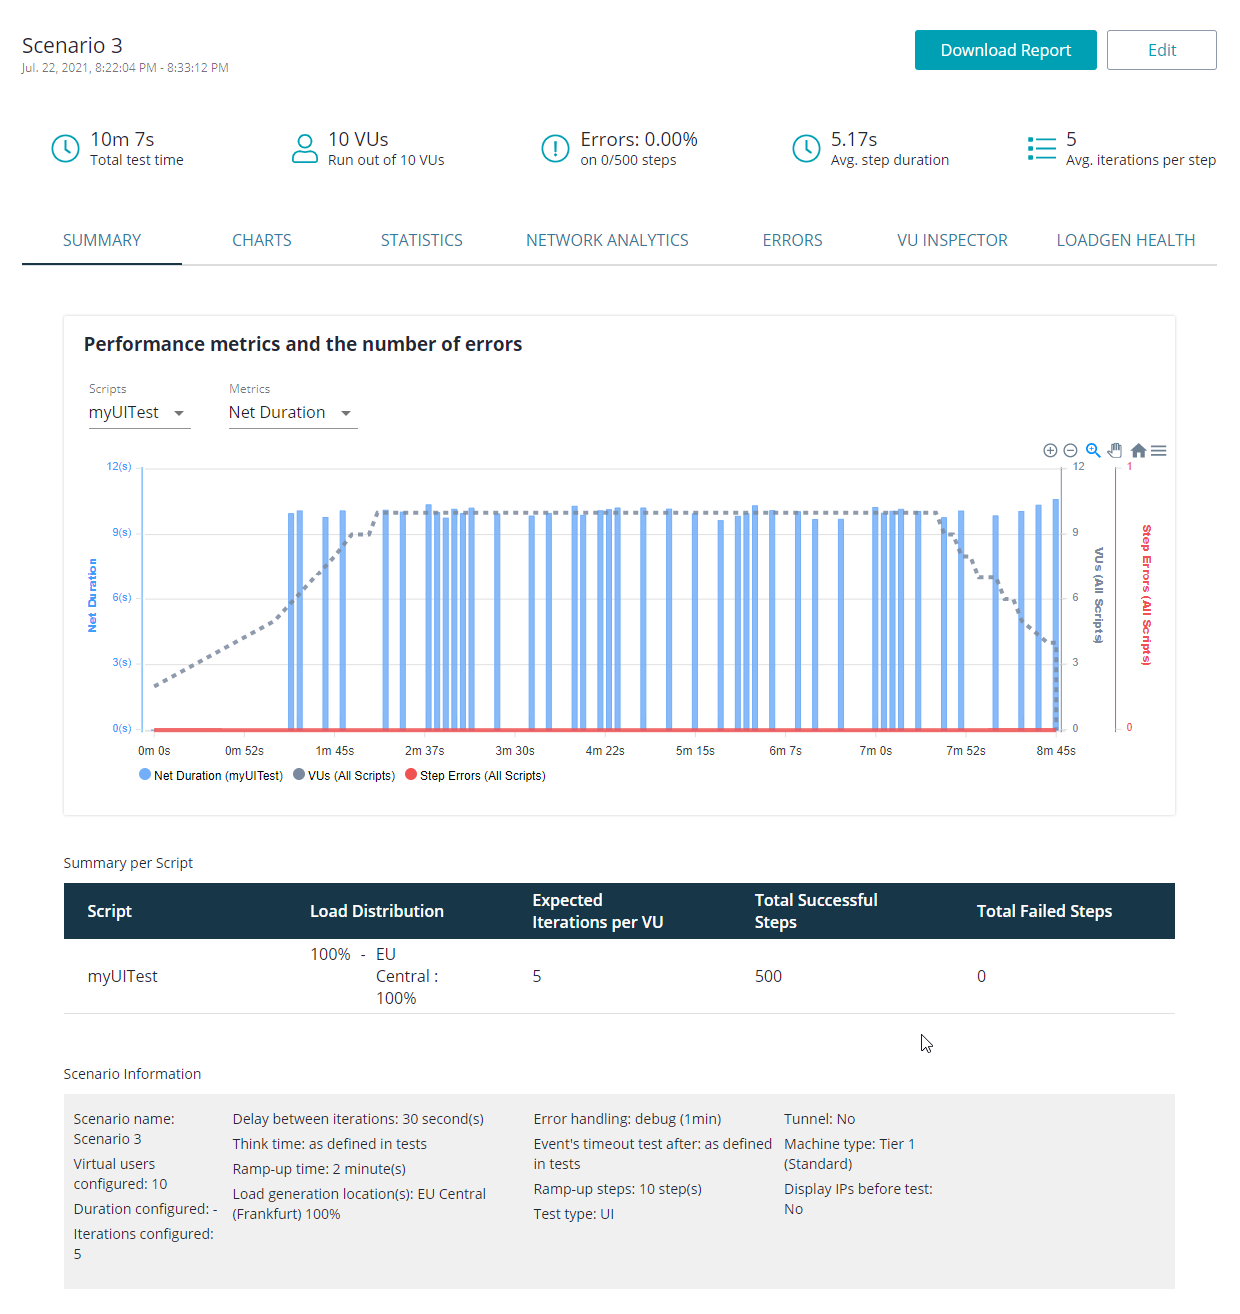
The toolbar contains:
- The name of the scenario you used for this run.
- The date and time when the run was performed.
In addition, check the test’s indices in a separate row:
-
— The time elapsed to run this test.
-
— The maximum number of concurrent virtual users the test had at a time.
-
— The number of errors occurred during the run.
-
— The average duration of the test step.
-
— The average number of iterations for each test step.
Summary tab
The Summary tab shows a short overview of your test run:
-
In Goals, learn about the specific parameters that were tested during the test run.
-
In Key Findings, learn about the issues encountered during the test run and suggested improvements.
To edit goals and key findings
Summary per Script
This panel contains statistics on how successfully virtual users performed script runs.
Column | Description |
---|---|
Script | The name of the script the virtual users performed. |
Load Distribution | The share of the load you set for this script in scenario settings. |
Expected Iterations | For iteration-based tests. The number of iterations each virtual user was supposed to run. |
Total Successful Steps | The number of test steps that the virtual users completed successfully. |
Failed | The number of test steps that the virtual users failed. |
Scenario information
This panel shows the scenario settings you specified for this load test run.
Charts tab
On the Charts tab, view charts that depict statistics on various aspects of the tested website.
LoadNinja offers the following charts:
Shows the average duration for running each script and step.
Shows the average time it took to move between the website’s pages, and locate and identify objects there.
Shows the number of errors for each script and step.
Statistics tab
On the Statistics tab, view metrics on timings and failure types. To get information on separate steps (URLs or synthetic steps) of a script, click the test in the list.
Durations and Errors
The Durations and Errors table shows the metrics on how long the scripts and steps are performed on the tested service, and the number of various failures that occurred during the test run.
Low duration values are preferable, since the faster your service responds, the more requests per minute it can process.
The table includes the following columns:
Column | Description |
---|---|
Script Step Name |
The name of the script or step. |
Last duration | The time it took virtual users to run the script or step last time, in seconds. |
90th percentile duration | This value indicates the maximum duration for 90% of scripts or steps, in seconds. For each of these scripts and steps, the actual time may be less than this value, but not greater. |
95th percentile duration | This value indicates the maximum duration for 95% of scripts or steps, in seconds. For each of these scripts and steps, the actual time may be less than this value, but not greater. |
Average duration | The average time it took virtual users to perform a script or step on the tested service, in seconds. |
Minimum duration | The minimum time it took virtual users to perform a script or step on the tested service, in seconds. |
Maximum duration | The maximum time it took virtual users to perform a script or step on the tested service, in seconds. |
Standard duration | The standard deviation of durations, in seconds. |
Total Iterations | The total number of iterations performed by all virtual users. |
Total steps | The total number of steps performed in the script by all virtual users. |
Total failures | The total number of errors all virtual users encountered during the test run. |
Total assertion failures | The number of validation failures that occurred during the run. |
Total timeouts | The number of timeout errors that occurred during the run. |
Total page errors | The number of page errors (for example, missing objects) that occurred during the test run. |
Average Navigation Times
Network Analytics tab
On the Network Analytics tab, you can view network statistics of your test steps and analyze the steps by using a built-in AI to find possible network issues. For more information, see Network Analytics Tab.
Note: | You can also open the Network Analytics tab from the Error Count chart by clicking a link in the tooltip that appears when hovering the mouse over the chart. |
VU Debugger
The VU Debugger shows the error log and information on errors. Use this tab to identify the source of an issue, view network traces, perform debugging, and so on. For more information, see Debugging.
VU Inspector
The VU inspector shows desktops of remote cloud machines where virtual users are working.
Each frame contains the virtual user ID, the name of the script it runs, and the URL the user is on.
Loadgen Health
The Loadgen Health tab displays the performance metrics received from LoadNinja servers. It helps you identify cases where the test infrastructure is the cause of errors that appear in test results.
To learn more about the tab, see Loadgen Health Tab.