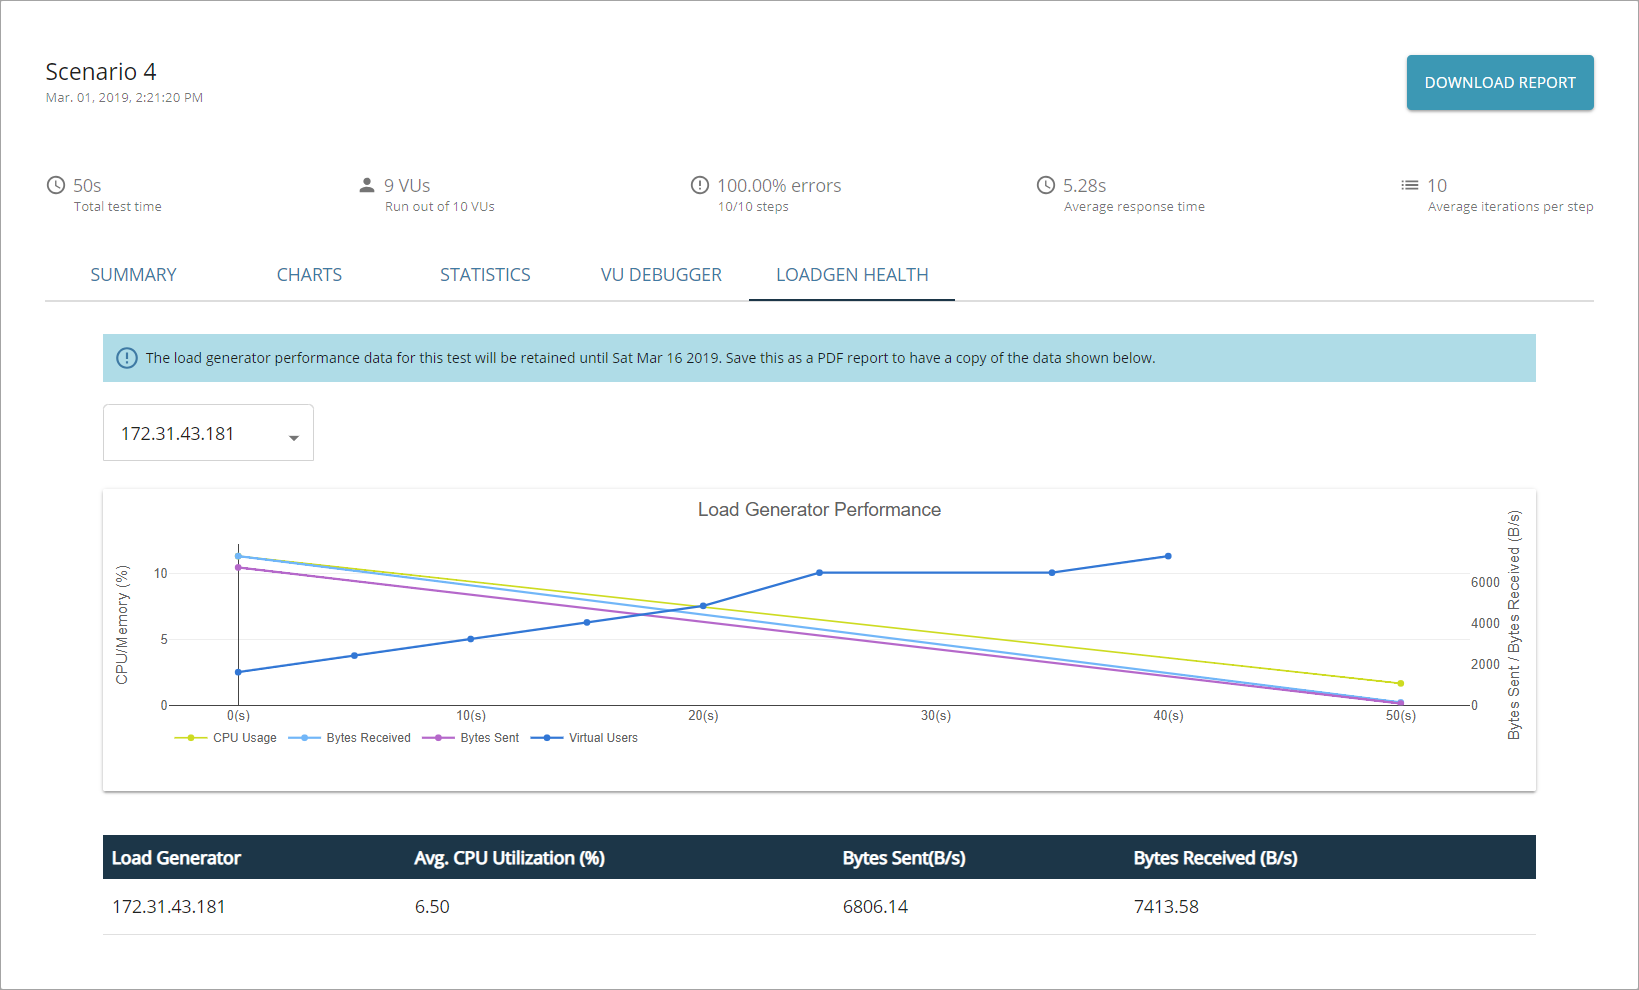
The Loadgen Health tab of the test results screen displays the performance metrics received from LoadNinja servers. It helps you identify cases where the test infrastructure is the cause of errors that appear in test results. With these metrics at hand, you can decide how many virtual users can be engaged in load test runs. LoadNinja performs differently depending on the complexity of your UI or API tests, so it is a huge advantage to know about its capacity.
The Loadgen Health tab includes the following elements:
-
IP address — Expands the drop-down list to switch between multiple load generators and to view statistics on each of them.
-
Chart — Shows LoadNinja server performance metrics in a graphical form.
-
Table — Shows metrics on average values gathered during the test run.
 LoadNinja stores the load generator health data for 16 days after the load test run is over. To preserve the gathered data, save it as a PDF report by clicking Download Report.
Loadgen Health chart
The chart shows how the load generator usage changed during the load test run.
Working with the chart
-
To show only one graph, double-click the name of this graph in the chart legend.
-
To stop showing a graph, click the name of its graph in the chart legend once.
-
To zoom in a segment of a chart, select it with your mouse.
-
To restore the default scaling of a chart, double-click on its legend.
The diagram includes the following measurements:
-
Horizontal — The duration of the test run.
-
Vertical — The percentage of used CPU and memory of the LoadNinja server; the data transfer rate.
Graphs
The graphs that appear by default:
-
The number of virtual users.
-
The CPU usage on the LoadNinja server.
-
The number of bytes received by the LoadNinja server.
-
The number of bytes sent by the LoadNinja server.
Table
The table shows metrics on load generator values gathered during the test run.
| Column | Description |
|---|---|
| Load Generator | The IP address of the LoadNinja server. |
| Avg. CPU Utilization (%) | The average percentage of used CPU capacity. |
| Bytes Sent | The amount of data the LoadNinja server sent while interacting with the tested service, per second. |
| Bytes Received | The amount of data the LoadNinja server received while interacting with the tested service, per second. |
Fix issues with load generator health
To reduce the consumption of LoadNinja servers’ resources, do the following:
-
Reduce the complexity of your UI or API test by deleting unnecessary steps,
-
Upload shorter databanks,
-
Reduce the number of virtual users in scenario settings.


