
The Summary tab of the test results screen provides a brief overview of the test run and accumulated results. This tab is active by default on the screen.
Summary Chart
The chart at the top shows how various metrics changed during the test execution. It also helps you see the correlation between the metrics and the number of simulated VUs and errors. The chart displays data for one UI or API test that virtual users simulated:

Click the image to enlarge it.
Move the mouse pointer over the chart to see metric values at certain time points.
Metrics
| Metric | Description | ||
|---|---|---|---|
|
Gross Duration |
Total step execution time (includes think times of individual test events). |
||
|
Net Duration |
Step execution time excluding test events’ think times. In other words:
|
||
|
Response Time |
The total time during the test run (on all iterations of the selected test) that the browser spent waiting for the response from the server. This includes time periods spent on DNS resolving, setting up a connection to the tested server (if needed), processing redirects, and transferring data over the network. 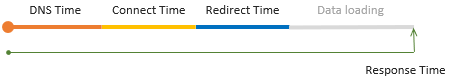 |
||
|
3rd-Party Response Time |
The response time taken for requests to domains different from the domain of the navigated URL. Examples of these third-party domains include Google Analytics, font storages, Facebook, weather info providers, and so on. This value helps you understand how much time your pages spent on requesting third-party sites. |
||
|
Think Time |
The sum of all Think Times in the simulated test. This value doesn’t include non-blocking Think Times, that is, the Think Time values that didn’t cause pauses in the network activity (see below). |
||
Non-Blocking Think Time |
This metric is a sum of Think Time values that don’t pause the test playback. A typical test has multiple think times in it. For example, a recorded UI test has Think Times for almost every recorded event. Depending on the length and location of these Think Times in the test, they might pause the test execution or not. For example, a Think Time at the beginning of the test step, most probably, doesn’t block the test run, because at this time the browser is still sending requests and loading resources requested by the current page. However, a long Think Time at the end of the test step will most likely pause the test run, because all the resources, most probably, have been downloaded and the test engine spends time idling. |
||
|
Front-End Processing Time |
The time spent on client-side processing. This includes time for running JavaScript client code, various actions with DOM, and so on.
|
Working with the chat
-
Zoom in or zoom out chart regions. The easiest way to do this is to drag the mouse pointer within the chart – this will select a chart region and will zoom in on it.
You can also zoom in or out by using special buttons:
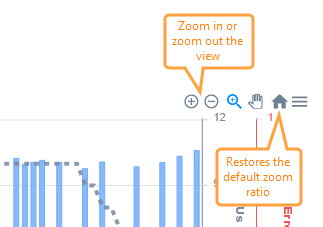
Note: The “zoom-in by dragging” mode works if the  setting is selected (it is selected by default).
 -
Show or hide metrics quickly:
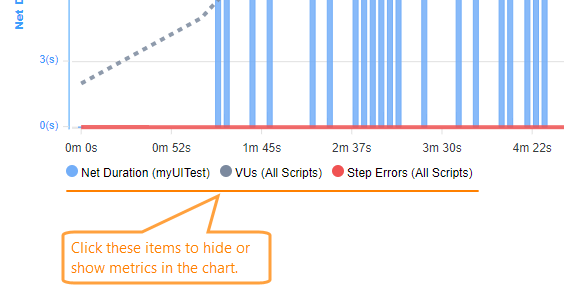
-
The
and  buttons specify how the chart handles mouse drags:
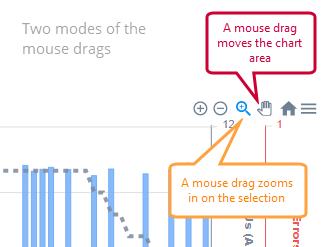
-
Export chart data using these menu items:
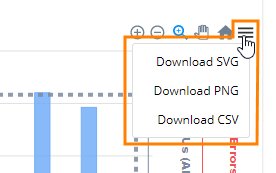
Menu items Description Download SVG
Download PNGSave the current chart view to an SVG or PNG file (that is, if you zoom in on some part, the images will have that visible part only, not the entire chart).
Download CSV Saves all chart data to a .csv file. You can then analyze and process the exported data in the way you need.
Summary per Script
This panel contains statistics on how successfully virtual users performed script runs.
| Column | Description |
|---|---|
| Script | The name of the script the virtual users performed. |
| Load Distribution | The share of the load you set for this script in scenario settings. |
| Expected Iterations | For iteration-based tests. The number of iterations each virtual user was supposed to run. |
| The number of test steps that the virtual users completed successfully. | |
| Failed | The number of test steps that the virtual users failed. |
Scenario information
This panel shows the scenario settings you specified for this load test run.