
The Statistics tab of the test results screen displays metrics on timings and types of failures happened during the test run. To get information on separate test steps (URLs or synthetic steps in UI tests; requests in API tests), click the test in the list.

Click the image to enlarge it.
Durations and Errors
The Durations and Errors table shows the metrics on how long the UI or API tests and their steps are performed on the tested service, and the number of various failures that occurred during the test run. Low duration values are preferable, since the faster your service responds, the more requests per minute it can process.
Below is the information about table columns. Some columns are hidden by default. To show them (or to hide the visible metrics that you don’t need), click ![]() on the top right of the table.
on the top right of the table.
Columns
Script / step name ![]()
![]()
The name of the simulated UI test or its test step.
Net Duration ![]()
The net execution time of a UI test or its step, in seconds. This values doesn’t include the Think Times of test events, that is —
In the Settings dialog, you can select to view average, minimum, or maximum Net Duration value among all the iterations of the same test (or step).
Gross Duration ![]()
![]()
The total execution time of a test (or test step) in seconds, including all the think time values.
In the Settings dialog, you can select to view average, minimum, or maximum Gross Duration value among all the iterations of the same test (or step).
Other available submetrics include —
Latest
The time it took virtual users to run the test or step last time.
90th Percentile
This value indicates the maximum duration for 90% of tests or steps, in seconds. For each of these tests and steps, the actual time may be less than this value, but not greater.
95th Percentile
This value indicates the maximum duration for 95% of tests or steps, in seconds. For each of these tests and steps, the actual time may be less than this value, but not greater.
Standard Deviation
The standard deviation of durations, in seconds.
OK Script Iterations ![]()
![]()
The total number of successful iterations performed by all virtual users.
Total steps ![]()
![]()
The total number of steps (or requests) performed in the UI or API test by all virtual users.
Total errors ![]()
![]()
The total number of errors all virtual users encountered during the test run.
Assertion errors ![]()
![]()
The number of validation failures that occurred during the run.
Timeouts ![]()
![]()
The number of timeout errors that occurred during the run.
Transactions per Second ![]()
The number of API requests simulated per second by all virtual users.
Page errors ![]()
The number of page errors (for example, missing objects) that occurred during the test run.
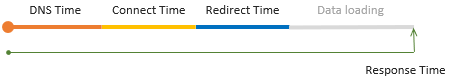
Response Time ![]()
The total time during the test run (or test step execution) that the browser spent waiting for the response from the server. This includes time periods spent on DNS resolving, setting up a connection to the tested server (if needed), processing redirects, and transferring data over the network.
In the Settings dialog, you can select to view average, minimum, or maximum Response Time values among all the iterations of the same test (or step).
3rd-Party Response Time ![]()
The response time taken for requests to domains different from the domain of the navigated URL. Examples of these third-party domains include Google Analytics, font storages, Facebook, weather info providers, and so on.
This value helps you understand how much time your pages spent on requesting third-party sites.
In the Settings dialog, you can select to view average, minimum, or maximum 3rd-Party Response Time value among all the iterations of the same test (or step).
Think Time ![]()
The sum of all Think Times in the UI test (or test step). This value doesn’t include non-blocking Think Times, that is, the Think Time values that didn’t cause pauses in the network activity (see below).
In the Settings dialog, you can select to view average, minimum, or maximum Think Times among all the iterations of the same test (or step).
Non-Blocking Think Time ![]()
This metric is a sum of Think Time values that don’t pause the test playback.
A typical test has multiple think times in it. For example, a recorded UI test has Think Times for almost every recorded event. Depending on the length and location of these Think Times in the test, they might pause the test execution or not. For example, a Think Time at the beginning of the test step, most probably, doesn’t block the test run, because at this time the browser is still sending requests and loading resources requested by the current page. However, a long Think Time at the end of the test step will most likely pause the test run, because all the resources, most probably, have been downloaded and the test engine spends time idling.
In the Settings dialog, you can select to view average, minimum, or maximum Non-Blocking Think Times among all the iterations of the same test (or step).
Front-end Processing Time ![]()
The time spent on client-side processing. This includes time for running JavaScript client code, various actions with DOM, and so on.
| Note: | Currently, this time also includes LoadNinja overhead (like time spent on JavaScript validations). |
In the Settings dialog, you can select to view average, minimum, or maximum Front-end Processing Times among all the iterations of the same test (or step).
Average Navigation Times
The Average Navigation Times table shows the average time it took virtual users to navigate between the website’s pages and locate and identify objects there.
Navigation timings
LoadNinja counts the following navigation timings, one after another:
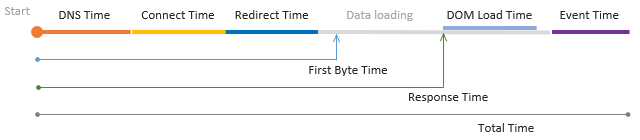
Each timing is counted separately. The total time is the overall duration of the load test.
Below is the information about table columns. Some columns are hidden by default. To show them (or to hide the visible metrics that you don’t need), click ![]() on the top right of the table.
on the top right of the table.
Script / step name ![]()
![]()
The name of the UI or API test, or test step.
Total Time ![]()
The average time it took to run the API load test, in seconds.
Total Nav Timings ![]()
The average time it took to run the UI load test, in seconds.
Think Time ![]()
The average time virtual users spent simulating pauses between user actions during the playback, in seconds.
Redirect Time ![]()
The average time, in seconds, virtual users spent following the redirects until getting to the final URL if the tested website had responded with an HTTP 301 or 302 redirect.
DNS time ![]()
The average time, in seconds, virtual users spent performing a DNS lookup, that is, obtaining the IP address of the website from a DNS server.
Connect Time ![]()
![]()
The average time, in seconds, virtual users spent performing a TCP handshake, that is, establishing a connection to the web server after the DNS lookup.
First Byte Time ![]()
![]()
The average time virtual users spent waiting for the first byte of the response from the server, in seconds. Its duration includes processing the requests, accessing the database of the server, selecting and generating a response, and depends on the server performance mostly.
Response Time ![]()
![]()
The average time passed from the moment when the client (a virtual user) sent the composed request until the moment the final byte was received, in seconds.
DOM Load Time ![]()
The average time it took to load and construct the DOM, in seconds. The DOM is considered completed when the DOMContentLoaded event is triggered.
Event Time ![]()
The total time, in seconds, it took to fully load the page, as well as all the resources it refers to, to the Document Object Model (DOM). The page is considered fully loaded when the onload event is triggered.