
You may want to compare the results of multiple test runs to determine the common errors that occur when working with the tested website, to find out how the website behaves under various load conditions, and so on.
Start comparing results
-
Click your project name in Projects, and then switch to the Test Runs tab.
-
On this tab, in the left column, select up to 4 check boxes for the reports you want to compare:

Click the image to enlarge it.
Tip: We recommend that you select the runs that are associated with the same scripts. It is possible to select runs for different scripts, but in this case, the comparison results will be of no use. -
Once ready, click Compare. The comparison report screen will appear:

Click the image to enlarge it.
Comparison report screen
Switch between the tabs on the comparison report screen to retrieve information on different comparison aspects:
-
Summary — Shows basic information about each test run included in the comparison, including data on separate scripts.
-
Charts — Shows customizable comparison charts.
-
Step Metrics — Shows the step duration metrics: average, minimum, maximum, standard deviation, and think times. It also includes navigation timings.
-
Errors — Shows the overall number of errors for each test and metric. The errors are grouped by their type.
To learn more about each tab, see below.
Download the comparison report
-
Click Download Report in the top right corner of the screen:

Click the image to enlarge it.
-
In the subsequent dialog, specify a name for the report file and select the preferable file format in Save Type:

Click the image to enlarge it.
Tip: LoadNinja supports saving reports in the PDF, PNG, and JPG formats. -
Once ready, click Download to generate a report and save it on your device.
Reference
In this section, learn about the metrics and fields LoadNinja shows in comparison reports.
Summary tab

Click the image to enlarge it.
Test run comparison panel
This panel shows the following information on each test run:
Click the image to enlarge it.
| Column | Description |
|---|---|
| Test run name | The name of the scenario used for the test run. |
| Started test | The date and time the test run started. |
| Completed test | The date and time the test run ended. |
| Duration configured | The preconfigured duration of the test, in minutes. Used for duration-based tests. |
| Total run time |
The total run time of the test, in minutes. |
| Ramp-up time | The “warm-up” period of the load test, in minutes. |
| Delay between iterations | The preconfigured pause between script runs performed by a virtual user, in seconds. |
| Average step duration | The average amount of time it takes a virtual user to perform a test step. |
| VUs configured | The number of virtual users requested for the test run. |
| VUs run |
The actual number of virtual users LoadNinja provided. Tip: Usually, this number differs from the VU configured value if a warm-up time is required (that is, the test starts with 1 virtual user, and the number of users will increase over time), but some error caused the test to end prematurely. |
| Iterations configured | The preconfigured number of iterations (for iteration-based tests). |
| Iterations completed | The actual number of iterations completed by virtual users. |
Script comparison panel
This panel shows the following information on each script:
| Column | Description |
|---|---|
| Scripts run | The scripts selected for the test run. |
| Number of scripts | The number of scripts associated with the test run. |
| Number of steps | The overall number of steps in all the completed iterations of the script. |
Charts tab
This tab shows customizable charts of separate scripts or steps:

Click the image to enlarge it.
To add a chart
-
Click Add a chart.
-
Select the needed scripts or steps to include in the comparison:

Click the image to enlarge it.
Tip: Use the search box to find the needed item quickly. Optionally, change the chart’s name in Chart Title, then click Next: Select Metric.
-
Select the metrics you want to include in the comparison. Possible options include: the number of virtual users, the total duration, think time, error counts, and navigation timings:

Click the image to enlarge it.
Once ready, click Add chart.
To edit a chart
-
Select > Edit Chart next to the needed chart name on the Charts tab.
-
Use the subsequent dialog box to modify the chart. The available options are the same as when adding the chart.
-
Once ready, click Add a chart.
To remove a chart
-
Select > Remove Chart next to the needed chart name on the Charts tab.
-
Confirm this action in the subsequent dialog.
Working with charts
-
To show only one graph, double-click the name of this graph in the chart legend.
-
To stop showing a graph, click the name of its graph in the chart legend once.
-
To zoom in a segment of a chart, select it with your mouse.
-
To restore the default scaling of a chart, double-click on its legend.
Step Metrics tab
This tab shows the duration metrics and navigation timings. They are grouped by scripts and steps associated with the compared runs:

Click the image to enlarge it.
Durations
| Column | Description |
|---|---|
| Average duration | The average time it took virtual users to perform a script or step on the tested service, in seconds. |
| Minimum duration | The minimum time it took virtual users to perform a script or step on the tested service, in seconds. |
| Maximum duration | The maximum time it took virtual users to perform a script or step on the tested service, in seconds. |
| Standard Deviation | The standard deviation of durations. |
| Think Time | A sum of pauses between actions within the script or step. |
Navigation timings
LoadNinja counts the following navigation timings, one after another:
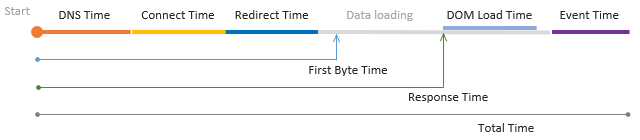
Each timing is counted separately. The total time is the overall duration of the load test.
| Column | Description | ||
|---|---|---|---|
| Total Time | The total time it took to run the script or step. | ||
| Redirect Time |
If the tested website has initially responded with an HTTP 301 or 302 redirect, this shows the time that a virtual user spent following the redirects until getting to the final URL. There may be several redirects, each needing another DNS lookup, TCP connection, and HTTP request, so the redirect time can be represented in greater details like this: 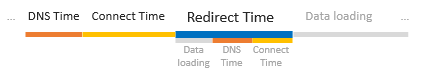
|
||
| DNS Time |
The time spent performing a DNS lookup, that is, obtaining the IP address of the website from a DNS server. If this value is elevated, it indicates that a virtual user had problems with reaching the DNS server and retrieving its response. |
||
| Connect Time |
The time spent performing a TCP handshake, that is, establishing a connection to a web server after the DNS lookup. If this value is elevated, this indicates possible network and routing problems or low efficiency of the server bandwidth. |
||
| DOM Load Time |
The total time it took to load and construct the DOM. The DOM is considered completed when the |
||
| Response Time |
The execution time of the first request on the page (the first page in the test step). That is, the total time passed from the moment when the client sent the composed request until the moment when the page’s HTML code got downloaded. |
||
| First Byte Time |
The time spent waiting for the first byte of the response from the server. Its duration includes processing the requests, accessing the database of the server, selecting and generating the response, and depends on the server performance mostly. If this value is elevated, this indicates a possible high server load, problems with database queries, memory leaks, or other performance issues. |
||
| Event Time |
The time it took the page’s |
Errors tab
This tab shows the following error metrics grouped by scripts and steps associated with the compared runs:

Click the image to enlarge it.
| Column | Description |
|---|---|
| Total errors | The number of errors (of all types) that occurred during the run of this script or step. |
| Assertion errors | The number of errors triggered by validations. |
| Timeouts | The number of timeout errors occurred during the run of this script or step. |
| Page errors | The number of page errors (for example, objects not found) occurred during the run of this script or step. |