Overview
The Network Analytics tab shows the network statistics of each test step. The analytics include, for example:
- The time spent making requests.
- The time spent loading web resources.
- The number of bytes received.
Collected network analytics can be represented as waterfall and pie charts. To obtain data, LoadNinja automatically selects a “sentinel virtual user” (VU) and collects statistics for that user on all the test iterations. Typically, the sentinel VU is one of the first VUs created during the test run.
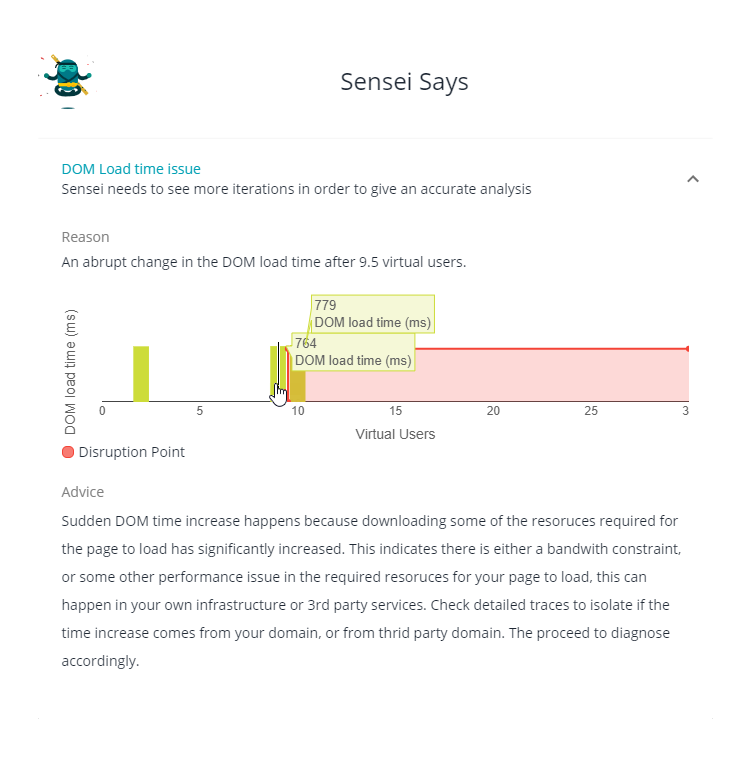
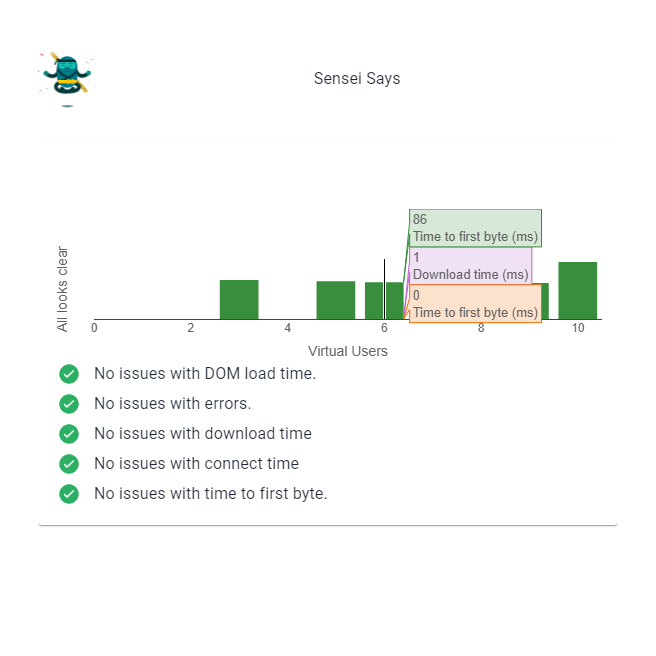
You can also analyze the test steps for issues using Sensei, a built-in AI component.
View Network Analytics
-
Select the Network Analytics tab.
-
Select the test step you want to analyze from the drop-down menu:
Note: When opening the Network Analytics tab, "Step 1." is selected by default.
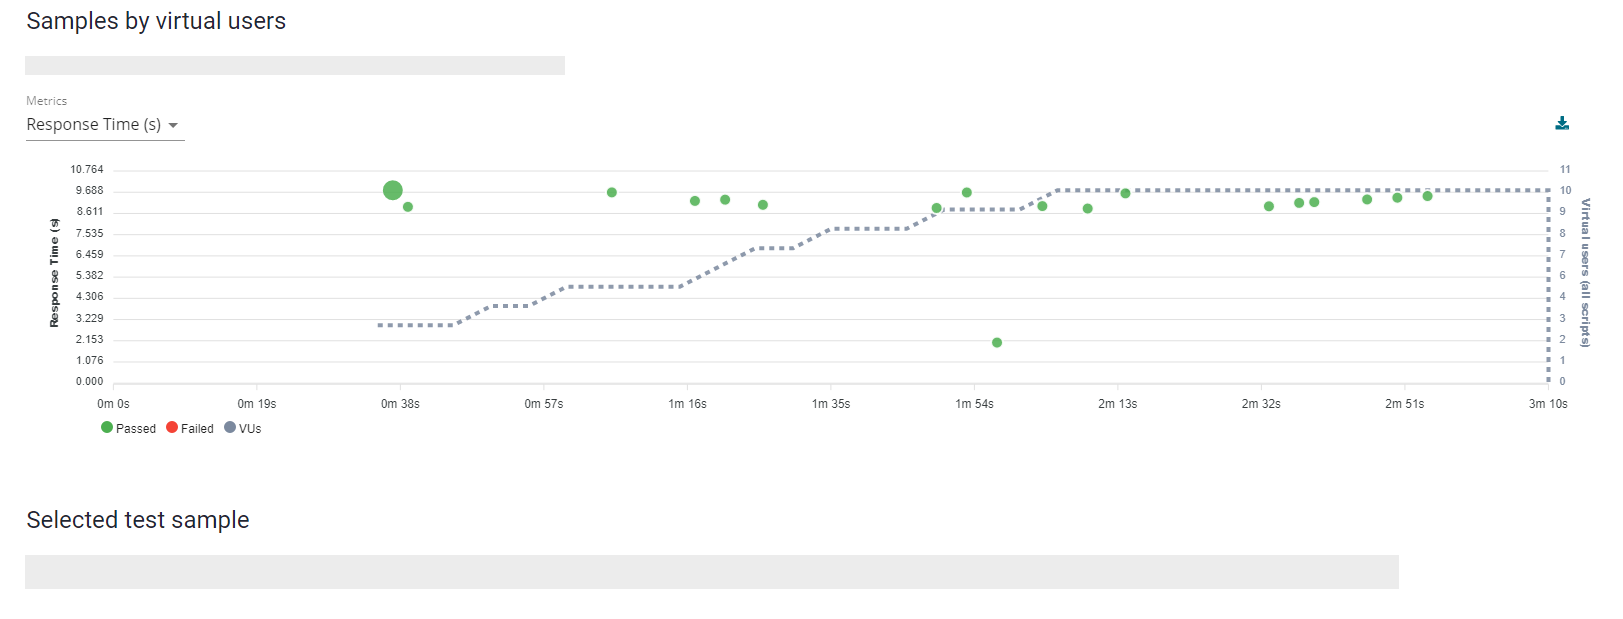
Result: A line chart opens, which represents the step run analytics:
 |
LoadNinja might be unable to collect network analitics data in case of short and small load tests. In such cases, consider extending the load test. |
Waterfall Chart
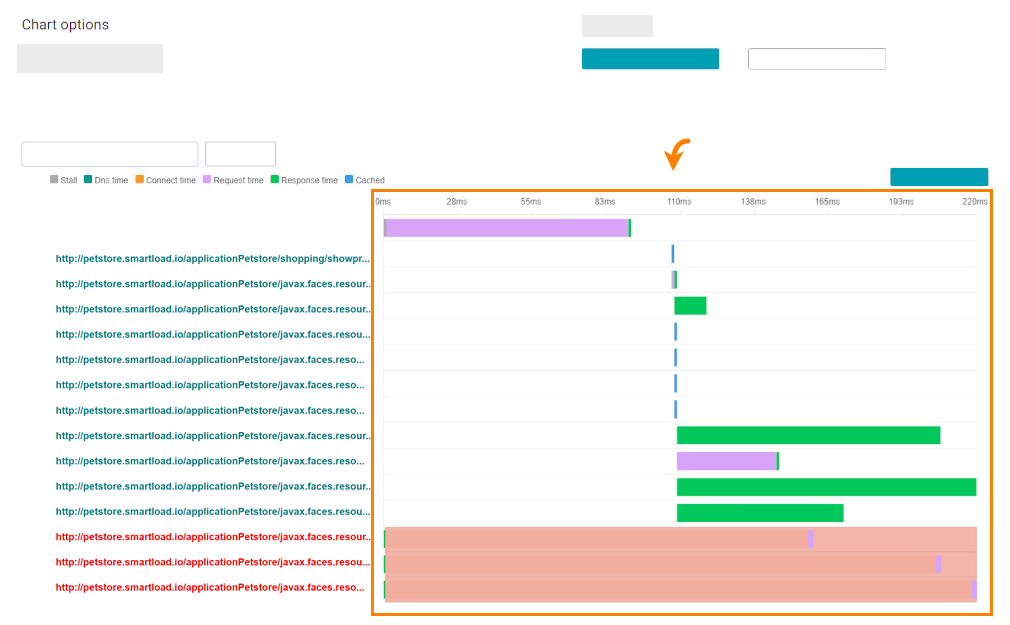
The lowest section of the editor shows a waterfall chart with information about requests sent to the server during the test step execution. Successfully executed requests are shown in green, failed requests are shown in red:
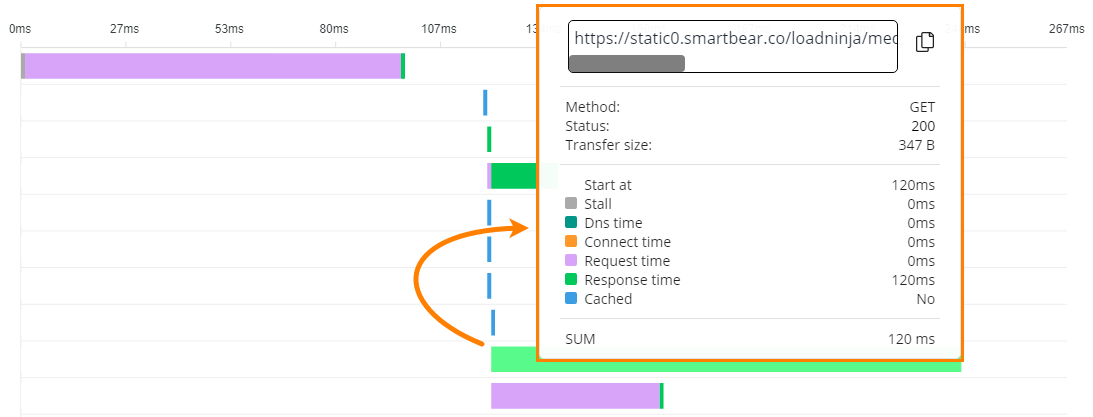
To view the details of a request, hover the mouse over its row in the waterfall chart:
| Field | Description |
|---|---|
| Stall |
The time the request spent waiting before being sent. |
| Dns time |
The time spent performing a DNS lookup, that is, obtaining the IP address of the website from a DNS server. |
| Connect time |
The time spent performing a TCP handshake, that is, establishing a connection to a web server after the DNS lookup. |
| Request time |
The time it took to send a request to the server and to get a response from it. |
| Response time |
The total time between the moment the client sent the request and the moment the page’s HTML code is downloaded. |
| Cached |
Indicates whether or not the endpoint call was cached by the browser. |
Filter Results in Waterfall Chart
You can filter out the displayed resources using the Filter by drop-down menu:
All
All resources of the page.
Navigation
URLs that were loaded first.
Link
Resources containing links to external files.
Script
Resources containing scripts or references to external scripts.
Image
Resources containing images.
Css
Resources that refer to style sheets.
XmlHttpRequest
Resources containing a server response. Usually, such responses hold data.
Iframe
Resources containing the body of an ifarme HTML element.
Beacon
Resources containing analytical data sent to the server.
Pie Chart
You can switch the chart type from waterfall to pie chart by selecting the PIE button under Chart type. You can group the analytics in the pie chart by the following parameters:
Hostname
By hosts
Pathname
By page resources
Resource type
By the types of downloaded files
Protocol
By the protocols used
Find Possible Issues with Sensei
Sensei is a built-in AI component of LoadNinja used to analyze test steps for possible issues.
To analyze a test step with Sensei:
-
Select Identify Anomalies under Utilities:
-
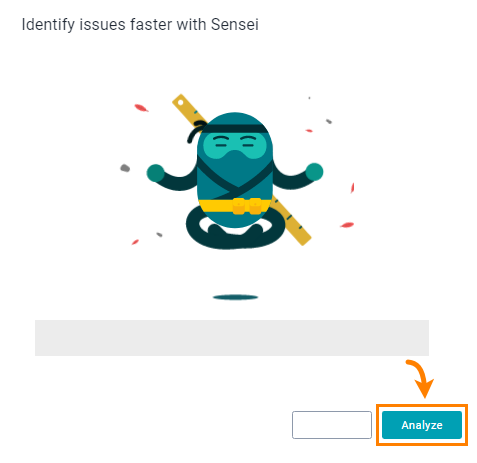
Select Analyze in the new window:
Result: Sensei analyzes the test step and provides a solution if it finds issues.
| Tip: | If you confirm the solution has helped resolve the issue, Sensei stores the solution it and will offer it for similar issues in the future. |
Download Data
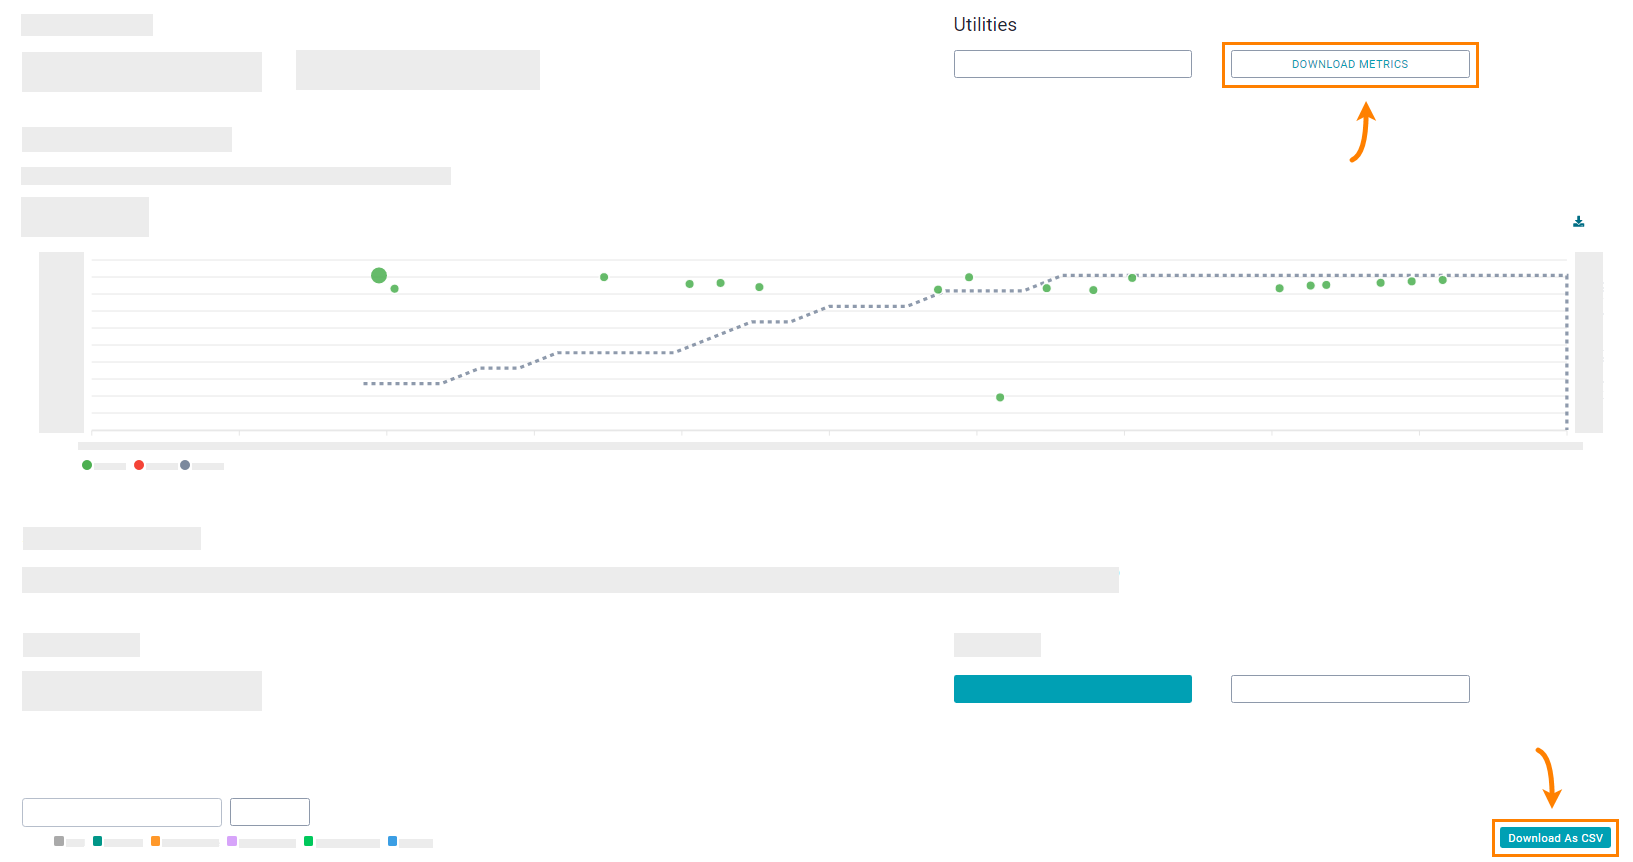
You can download the analytics data by selecting the Download Metrics or Download As CSV button:
The download buttons allow you to download a ZIP file with the following content:
Download Metrics
- Metrics for each iteration.
- Navigation timings for each iteration to see how metrics change from one iteration to the next.
- The sum of the "Total time" metric for loaded resources, for example, pages, images, CSS and script files.
Download As CSV
Metrics for the currently selected test iteration.



 Example