LoadNinja provides a handful of tools for debugging virtual users during test runs. This includes the debug mode that is accessible when issues occur during the test run, various metrics and statistics that allow identifying the reason for a problem, and much more.
Enable the debug mode
LoadNinja puts a virtual user in the debug mode when any issue occurs during the test run. Among these issues are:
-
Connection timeouts and other timeout errors.
-
Missing objects on pages.
-
Performance issues with HTTP operations.
-
LoadNinja validation failures.
Basically, a virtual user switches to the debugging mode in all cases when your service behaves somehow unexpectedly.
For this feature to work, set the On Error scenario setting to command LoadNinja to enable the debug mode:
-
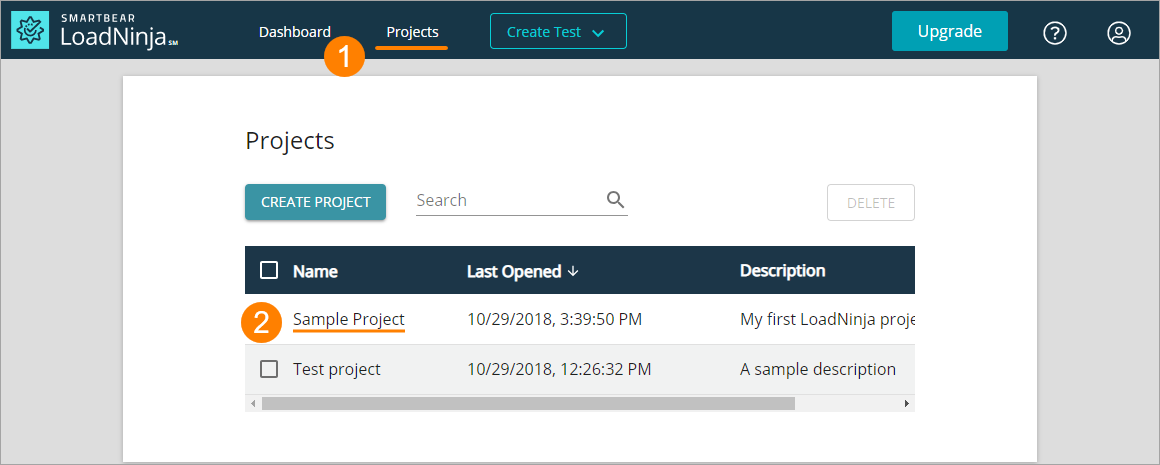
Go to Projects and click your project in the list:
-
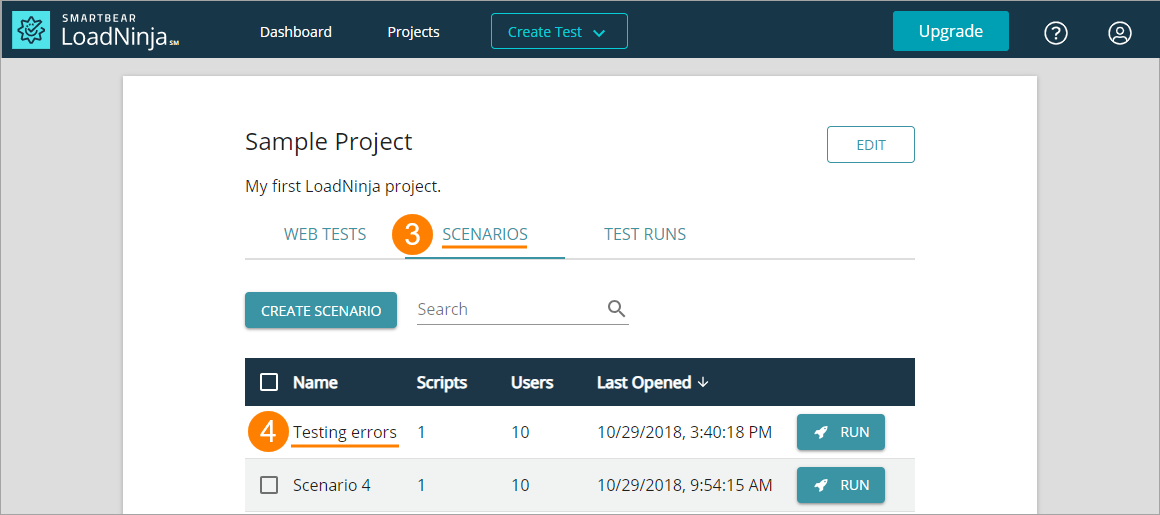
Switch to the Load Test Scenarios tab and then click your scenario:
Tip: Use the search box to filter the scenario list. It allows searching for a specific character in a scenario name or for a specific date. -
On the Error Handling panel, in On Error, select
Debug Error: -
In Debug Time, specify for how long a virtual user must stay in the debug mode on errors.

If the debug time passes with no actions from your side, LoadNinja commands a virtual user to end this particular iteration of a script run and launch the next one. To learn more about how LoadNinja runs tests, see Scenarios.
After this, on all subsequent load test runs of this scenario, a virtual user will enter the debug mode when the issues occur.
How to debug errors
To debug errors:
-
Interact with the virtual user on the results screen for the test run which is in progress. Wait until LoadNinja opens this screen automatically on the test start.
— OR —
-
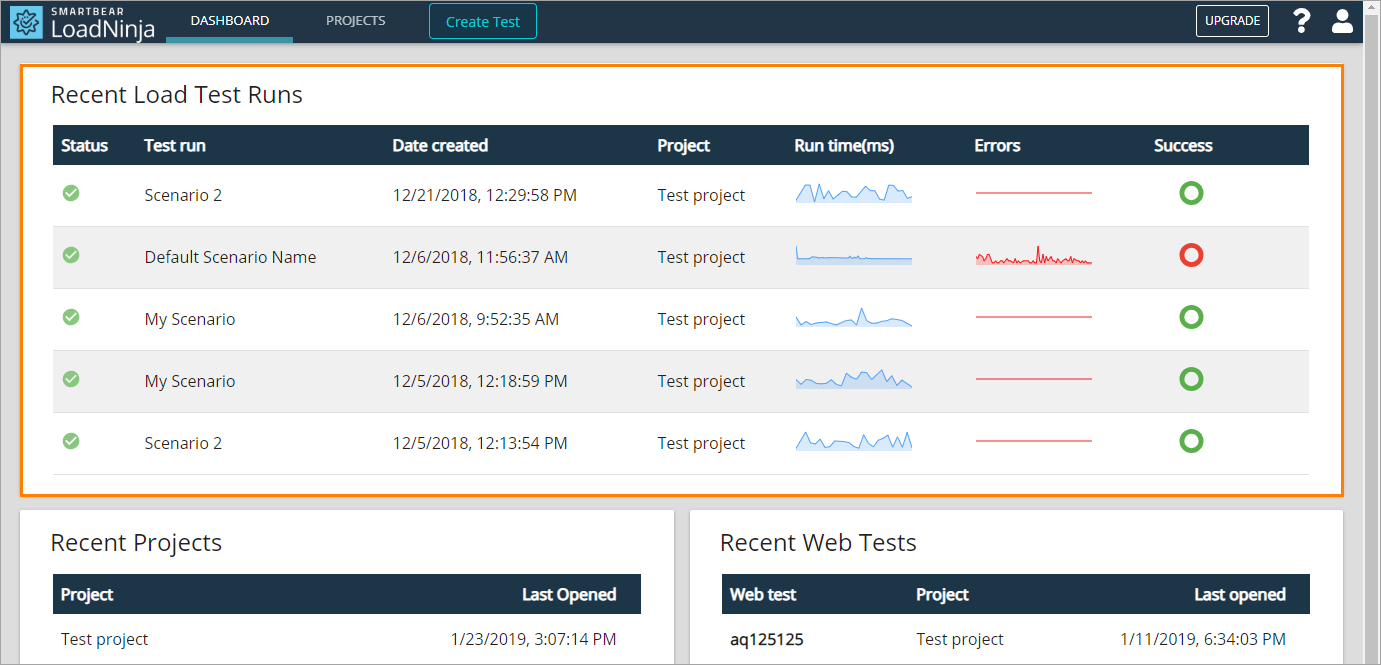
Select the needed test run on the Dashboard:
— OR —
-
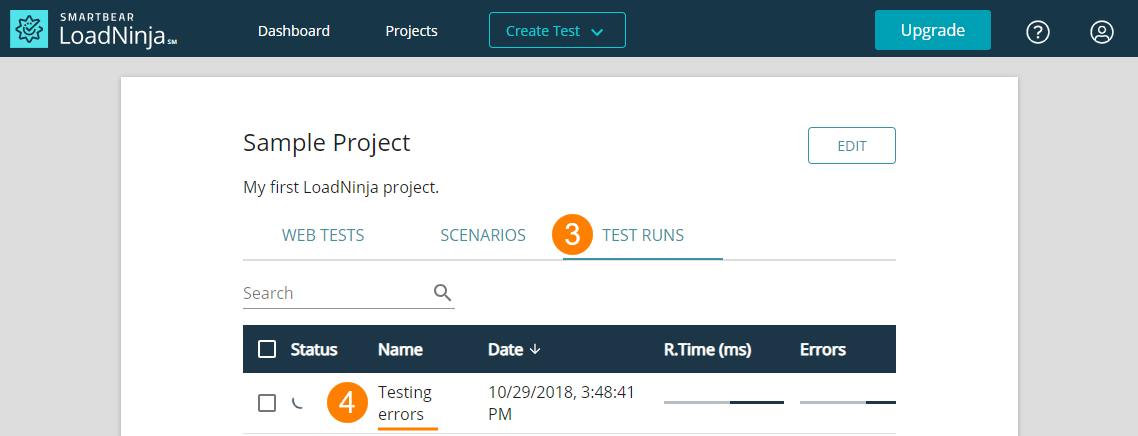
Open the test results screen from the Projects > Test Runes page.
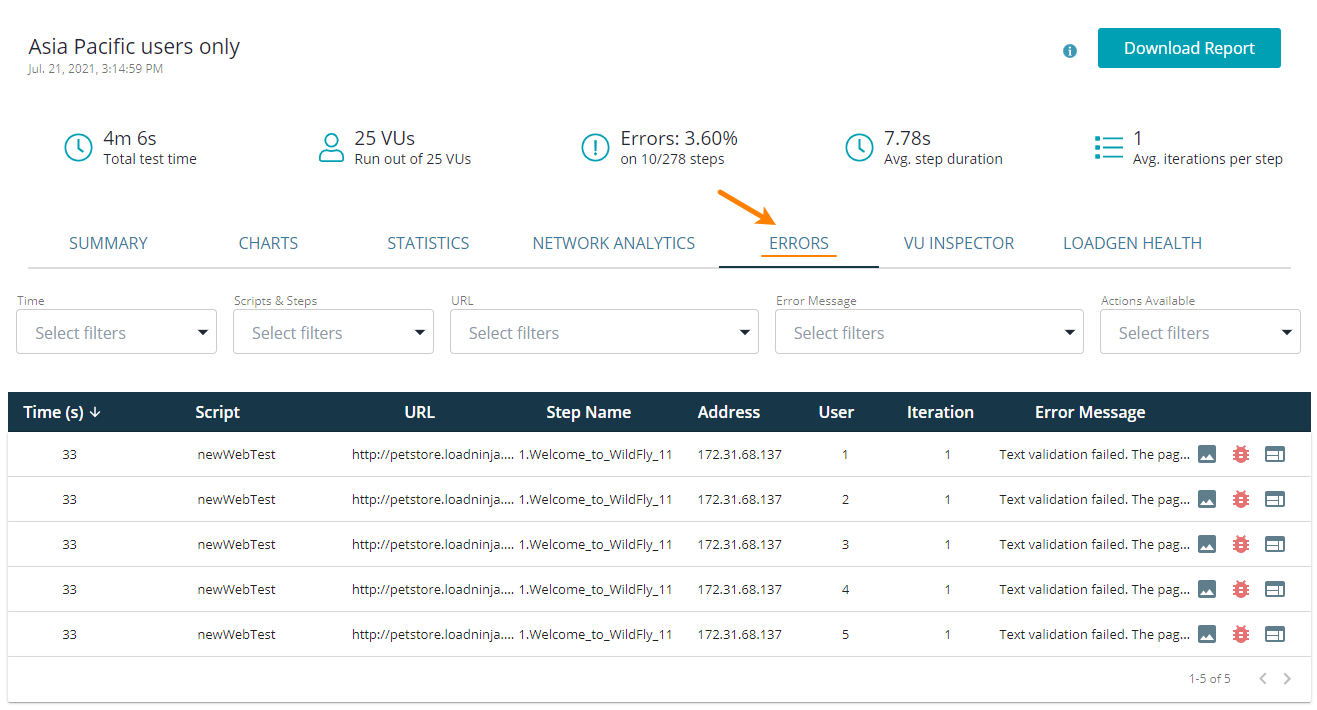
When the results screen opens up, switch to the Errors tab:
The Errors tab lists all errors that occurred during the test run.
 Learn more about error records
Use buttons on the right of an error record to perform debugging:
-
 Show Image — Show the page as the virtual user sees it when the error occurs.
 -
 View Network Traces — Show the network traces. Available for HTTP errors only.
 -
 Debug Mode — Open the debugging page for a virtual user which encountered the error.
 -
 Download HTML — Download the copy of the page in the state it was when the error occurred.
Note: This downloads only the .html file, without including any images or assets.
Navigate through error records
Debug mode
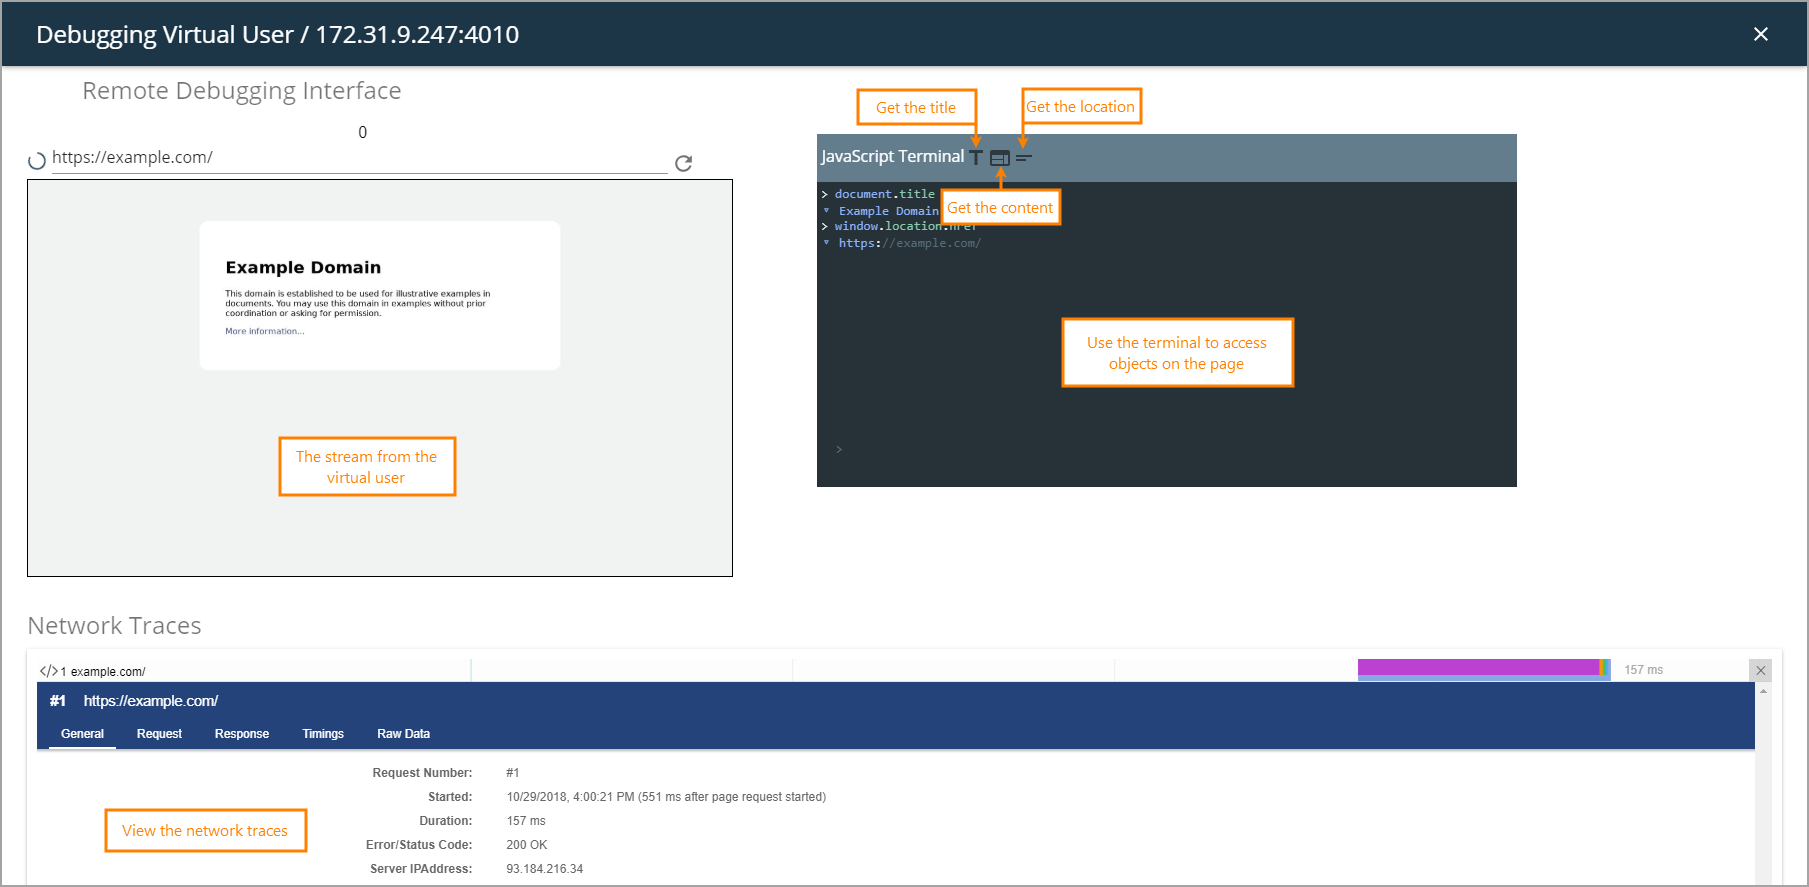
In the debug mode, analyze the state of the page a virtual user was interacting with when the error occurred.
-
On the page’s toolbar, check the IP of the virtual user to make sure the firewall or routing rules of your service allow this virtual user to access the service.
-
In the frame, view the URL and current state of the page.
-
Use the JavaScript Terminal to send various commands to the service.
LoadNinja provides full access to the tested page’s DOM via the
documentobject, so you can access web page elements in the same way as regular JavaScript uses in web pages:JavaScript
// Get an element by ID
var obj = document.getElementById("elem-id");
// Get the inner HTML code of the last element
var data = document.body.lastChild.innerHTML;To access various objects, use buttons on the terminal’s toolbar:
 — Get the page’s title.
 — Get the page’s URL.
 — Get the page’s content as an HTML code.
-
At the page’s bottom, view the network traces.
Network traces
View Network traces to identify the source of the issue that your virtual user encountered. Access them:
- On the Debugged tab of the results screen.
- In the debug mode.
The network traces panel is a table that contains URLs of all resources (pages, images, scripts) the virtual user tried to access during the iteration and timings for these URLs. All resources the virtual user had trouble accessing are marked with the ![]() icon.
icon.
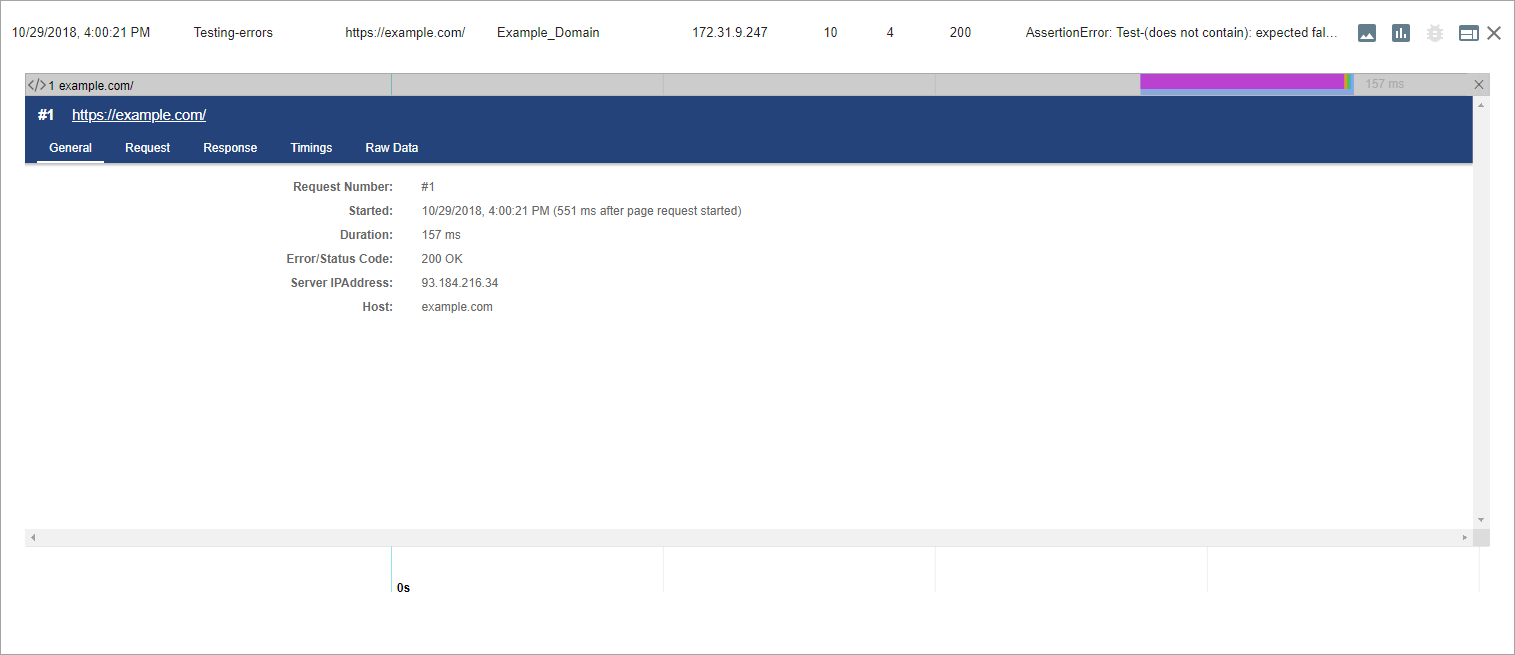
Click a URL in the list to view extensive information about an operation:
The General tab
The General tab contains an overview of the operation, including its duration, the time when it was started, the status code, the name and IP address of the server. It also shows errors and their description, if any occurred.
The Request tab
The Request tab contains information about the request, including all its headers.
The Response tab
The Response tab contains information about the response, including all its headers.
The Timings tab
The Timings tab contains information about the time it took the virtual user to complete the operation. This includes connection time, waiting time, as well as time spent to send the request and download the response.
The Raw Data tab
The Raw Data tab contains the raw representation of the operation in the HAR format used by LoadNinja. This includes representations of the request, response, and additional information LoadNinja gathers — such as the target server’s IP address, the date and time when the request was sent, and timings.
See Also
VU Inspector Tab
Test Web Apps in Local Network
Scenarios
Typical Use Cases

