When you run your load tests, LoadNinja generates various charts and metrics. Use them to quickly gather statistics on your test runs and debug issues.
Access test results
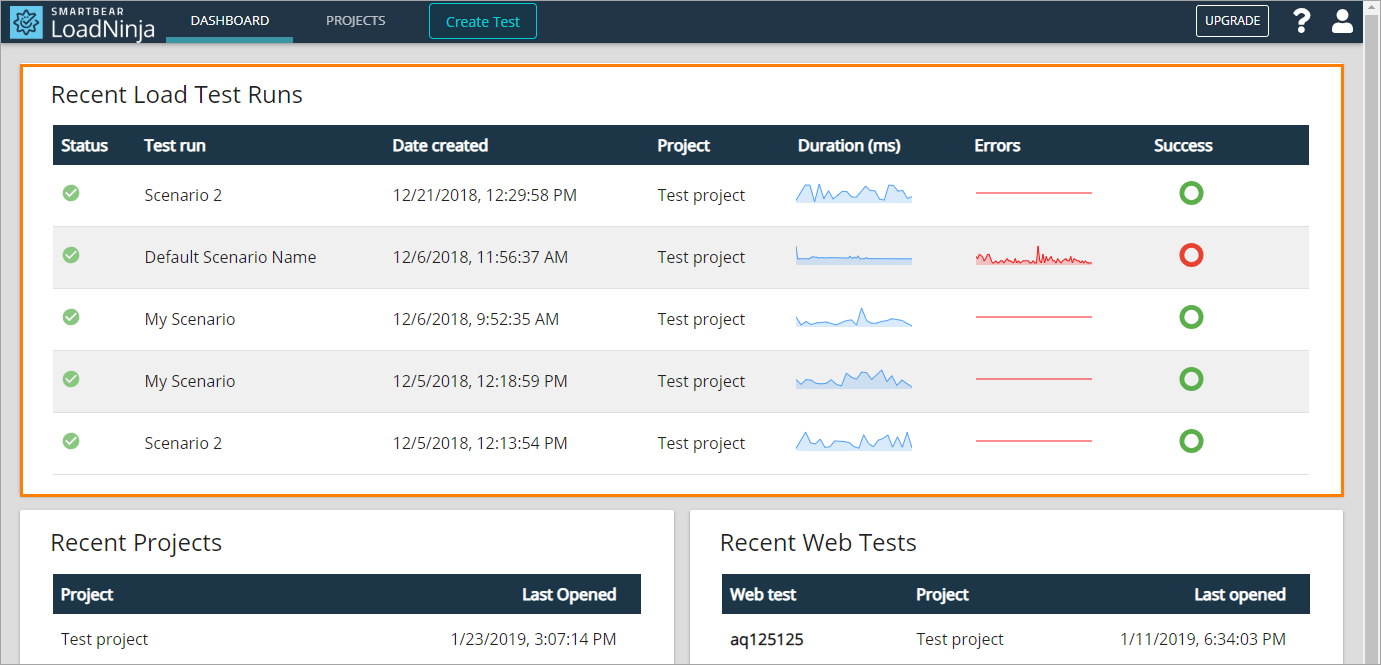
View the real-time test results on the results screen:
— OR —
-
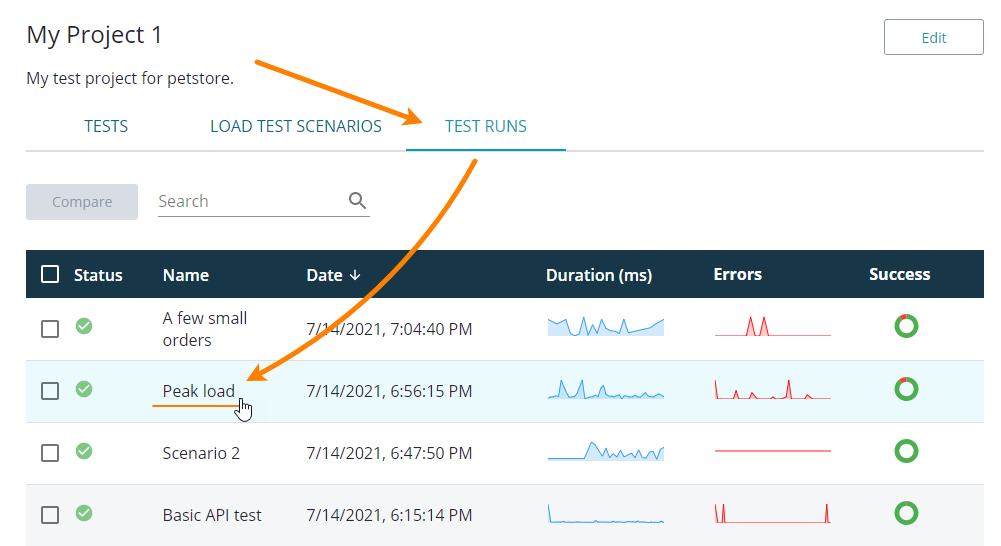
Go to Projects.
-
Click the needed project in the list.

Click the image to enlarge it.
-
Switch to the Test Runs tab.
-
Locate the needed test run in the list, then click it.

Click the image to enlarge it.
Tip: |
Use the search box to filter the test run list by a specific character in a test run name or a specific date. |
— OR —
Results screen
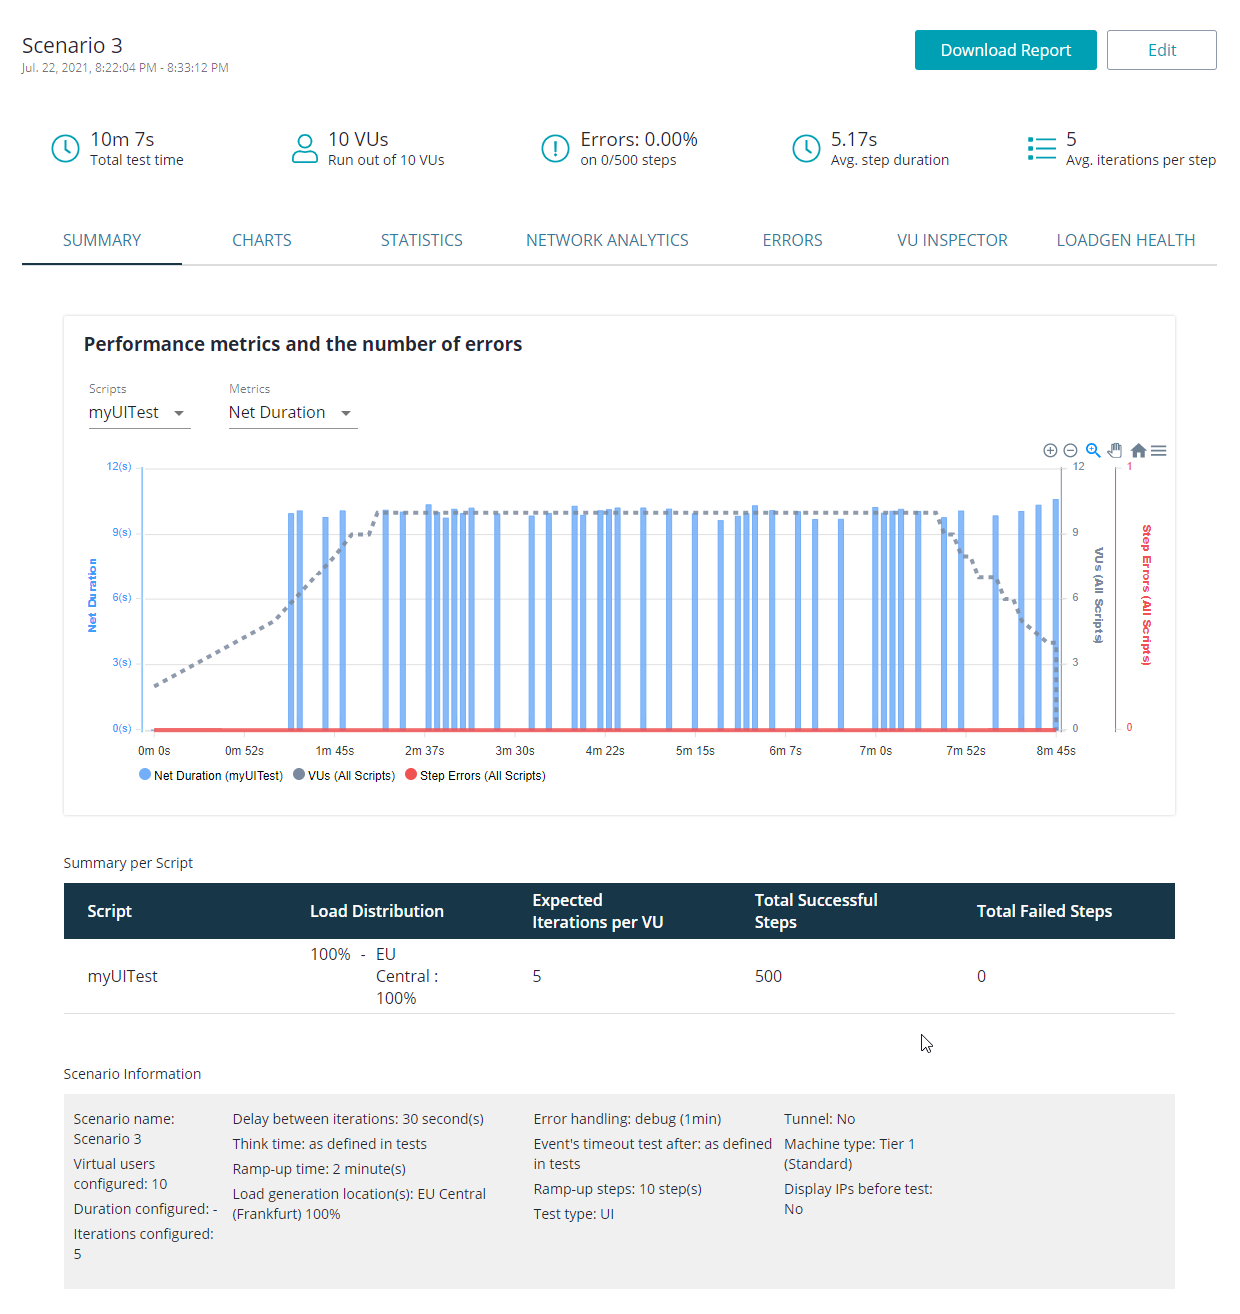
The results screen shows everything you may need to analyze the results and work with them:

Click the image to enlarge it.
-
Check various useful metrics on the toolbar.
-
Take a look at the short overview of the test run on the Summary tab.
-
View charts that depict statistics on various aspects of the tested service on the Charts tab.
-
View information on timings and failure types on the Statistics tab.
-
Perform debugging, view the error log and information on errors on the Debugger tab.
-
View remote desktops the virtual users are working with on the live video wall.
To learn more about the results screen and information available there, see Results Screen.
Download results
To download results in the PDF, PNG, JPG, or raw CSV format, click Save Report on the results screen.

Click the image to enlarge it.
CSV data
To retrieve extensive data on the test run in the CSV format, select Save Report > Raw CSV:
LoadNinja will zip up the file. The download starts automatically.
Learn more
Learn more
Learn moreThe resulting data is a CSV file. Each row corresponds to a specific step on the test run.
The table consists of the following columns:
URL_Step_Start |
The URL of the page the virtual user was on when the step execution was started.
|
Date_Time |
The date and time the step execution was started.
|
Status |
The execution status of the step.
Possible states: pass, fail.
|
VU ID |
The unique ID of the virtual user that performed the step, including its IP address.
|
Iteration count |
The serial number of this iteration for the virtual user, specified in VU ID.
|
Step name |
The name of the performed step in the LoadNinja script.
|
Duration (ms) |
The duration of the step execution, in milliseconds.
|
Redirect time (ms) |
If the tested website has initially responded with an HTTP 301 or 302 redirect, this shows the time that a virtual user spent following the redirects until getting to the final URL.
|
DNS time (ms) |
The time spent performing a DNS lookup, that is, obtaining the IP address of the website from a DNS server. If this value is elevated, it indicates that a virtual user had problems with reaching the DNS server and retrieving its response. |
Connect time (ms) |
The time spent performing a TCP handshake, that is, establishing a connection to a web server after the DNS lookup. If this value is elevated, this indicates possible network and routing problems or low efficiency of the server bandwidth. |
Time to first byte (ms) |
The time spent waiting for the first byte of the response from the server. Its duration includes processing the requests, accessing the database of the server, selecting and generating the response, and depends on the server performance mostly. If this value is elevated, this indicates a possible high server load, problems with database queries, memory leaks, or other performance issues.
|
Response time (ms) |
The total time passed from the moment when the client sent the composed request until the moment when the page’s HTML code got downloaded.
If the page refers to images, JavaScript, CSS files, and other external resources, they will not be included.
|
DOM load time (ms) |
The total time it took to load and construct the DOM. The DOM is considered completed when the DOMContentLoaded event starts.
The images, CSS, scripts, and other resources the page refers to may still be loading at this point.
|
Event time (ms) |
The time it took the page’s onload() event handler to run. It helps you understand how long the client-side scripts run when the page is loaded. |
Region |
The region, where the virtual user was situated.
Possible values:
- ap-south-1 — AP South (Mumbai)
- eu-north-1 — EU North (Stockholm)
- us-east-1 — US East (N. Virginia)
- us-west-1 — US West (N. California)
- ap-southeast-1 — AP Southeast (Sydney)
- eu-west-1 — EU West (London)
- eu-central-1 — EU Central (Frankfurt)
- ca-central-1 — AP Central (Canada)
|
Compare results
To compare results of up to 4 different runs, select check boxes near the needed runs and click Compare Results.
To learn more, see Compare Test Results.
See Also
Typical Use Cases
Scenarios