Let’s analyze the Function Trace profiler results.
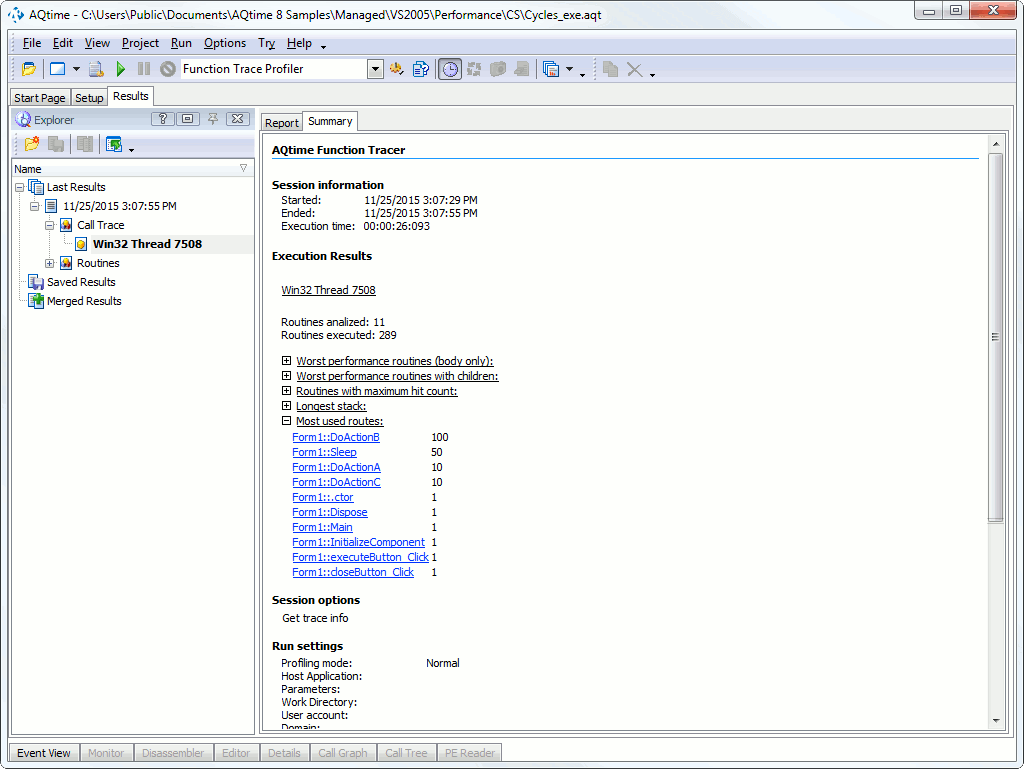
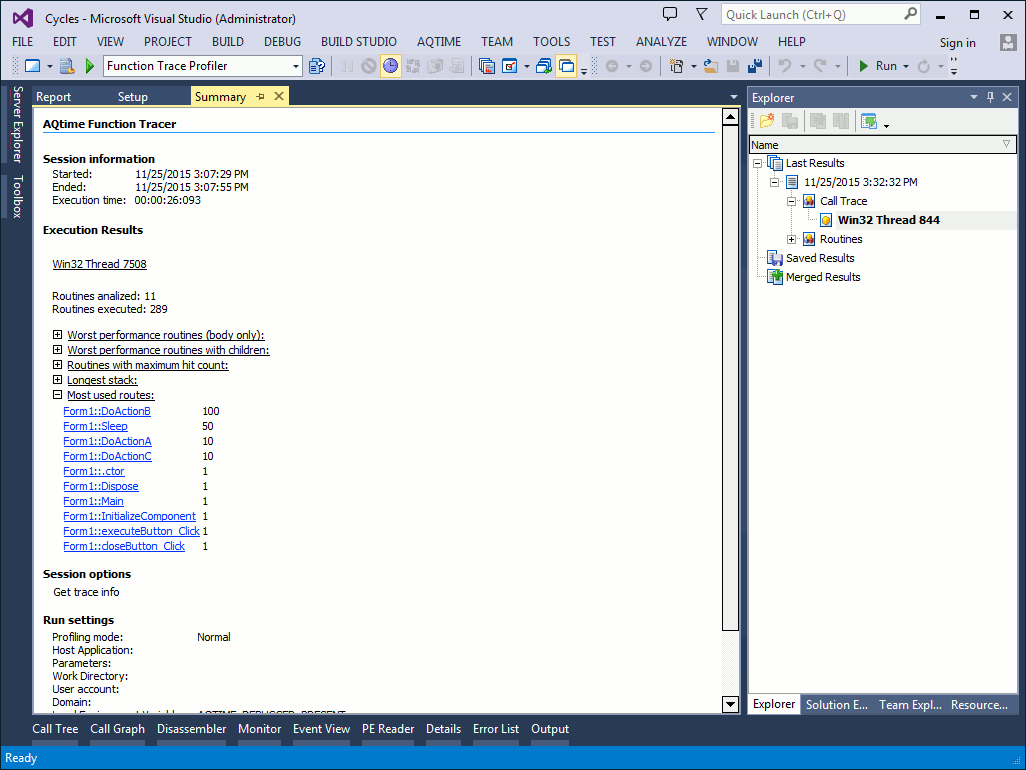
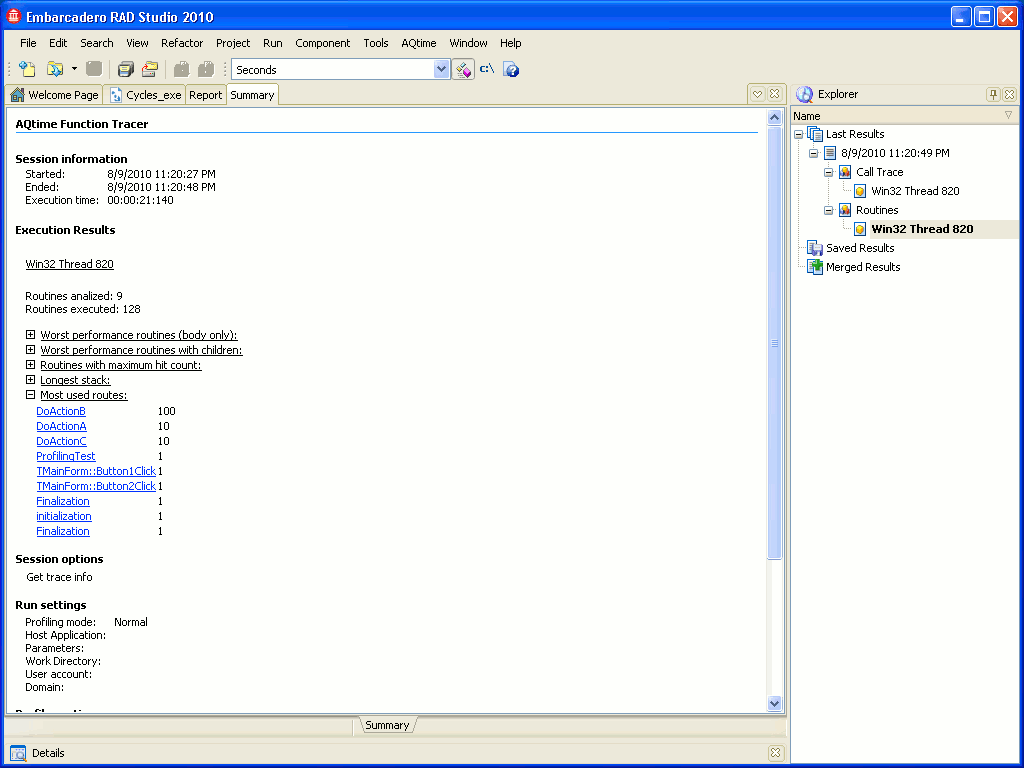
Switch to the Summary panel. It provides information about system environment settings, profiling options and contains brief profiling results. From these results you can find the worst performing routines, routines that are called most than others, routines that have the longest call stack and routines that have the longest routes:
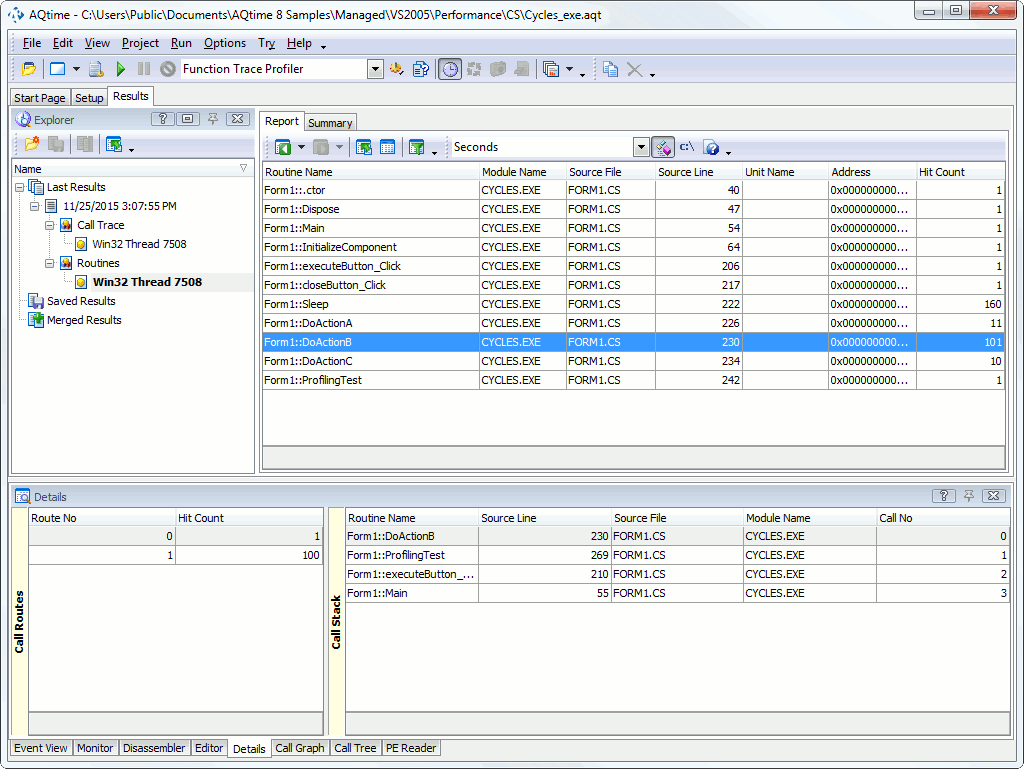
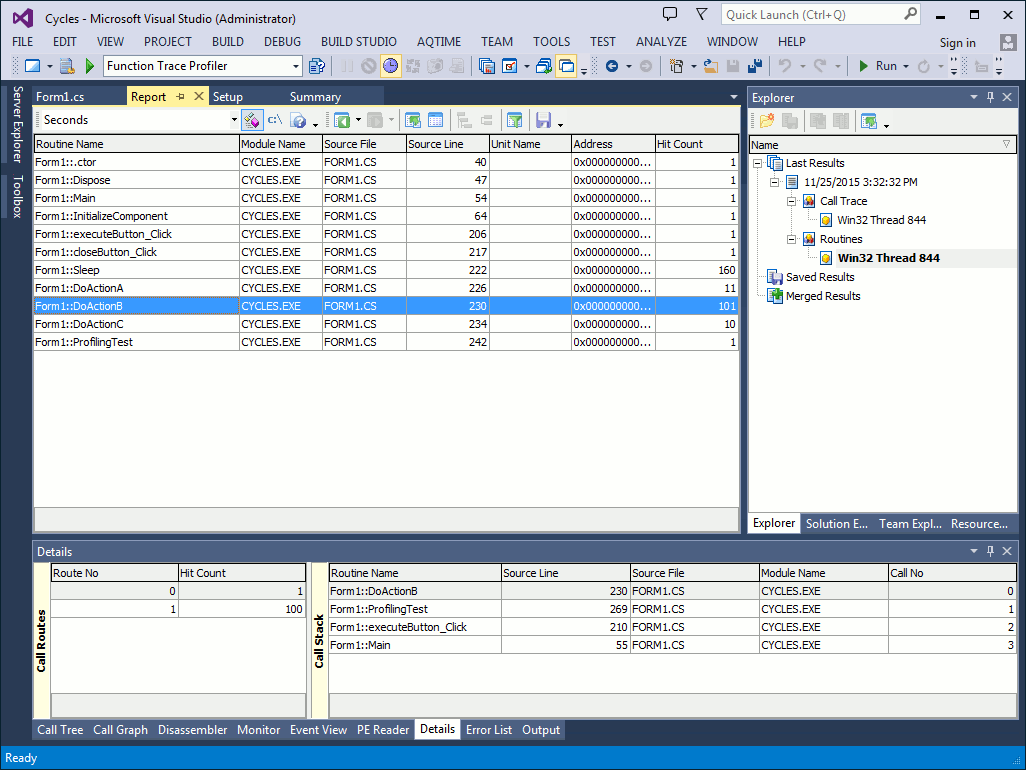
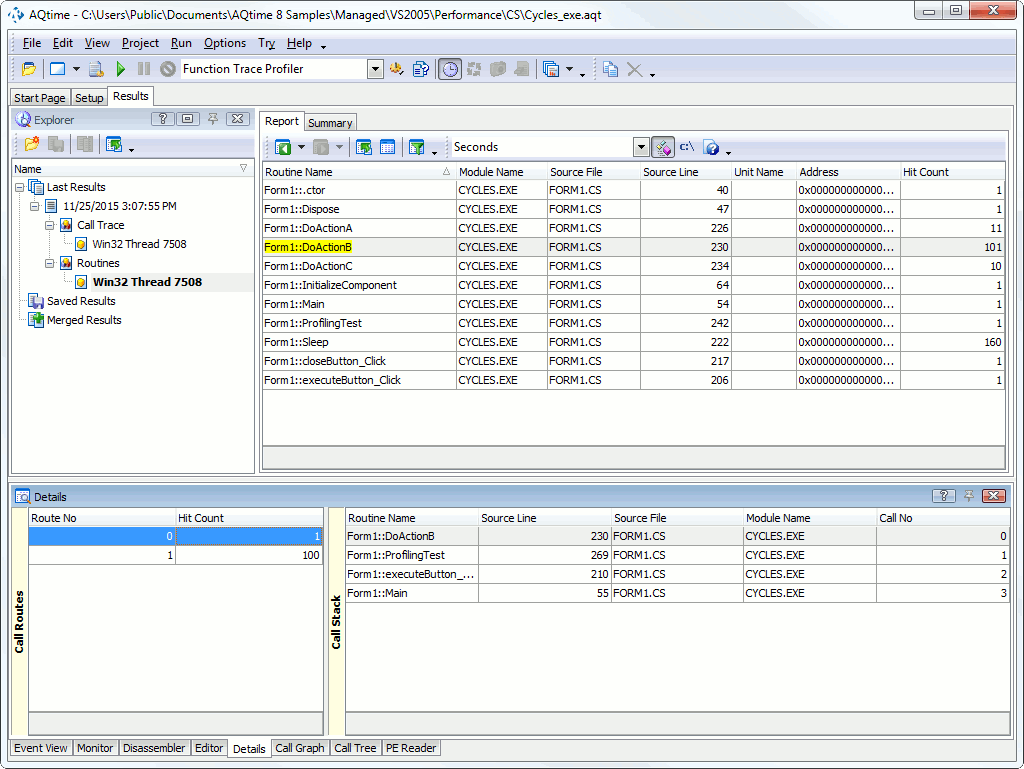
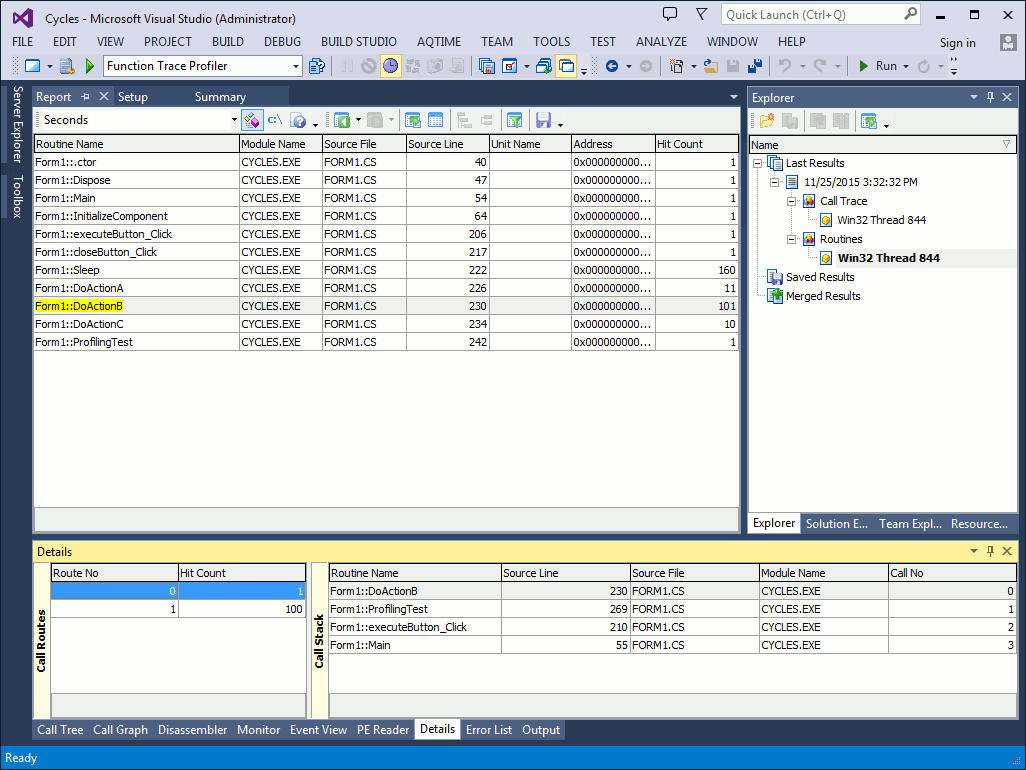
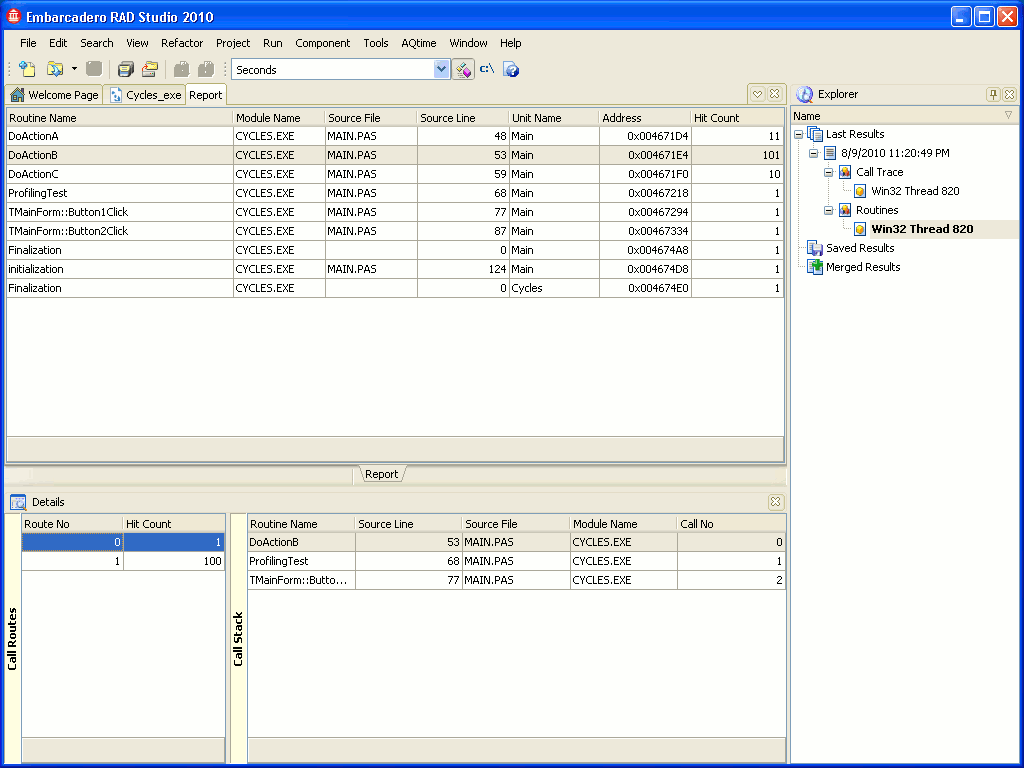
Other AQTime panels provide more detailed result views. Here is a sample output of the Function Trace profiler:
As you can see, profiling results are organized into categories - Routines and Call Trace - that are shown in the Explorer panel.
Select the Routines category. When this category is selected, the Report panel displays information about routines in the profiled module(s) and the Details panel displays calling routes for the routine that is selected in the Report.
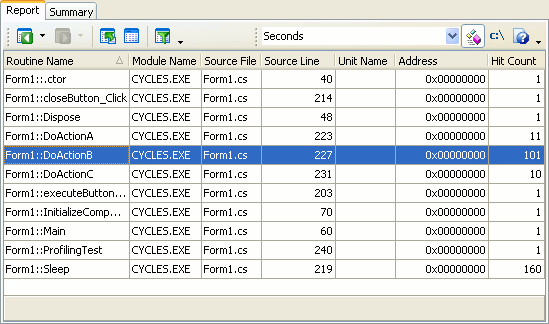
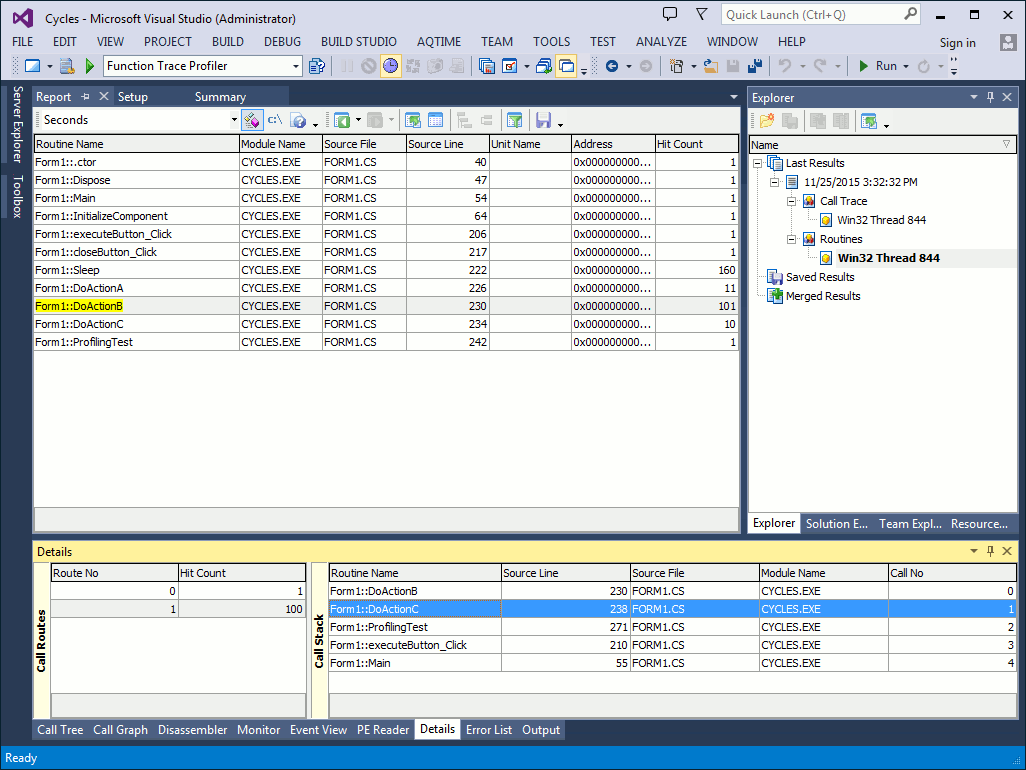
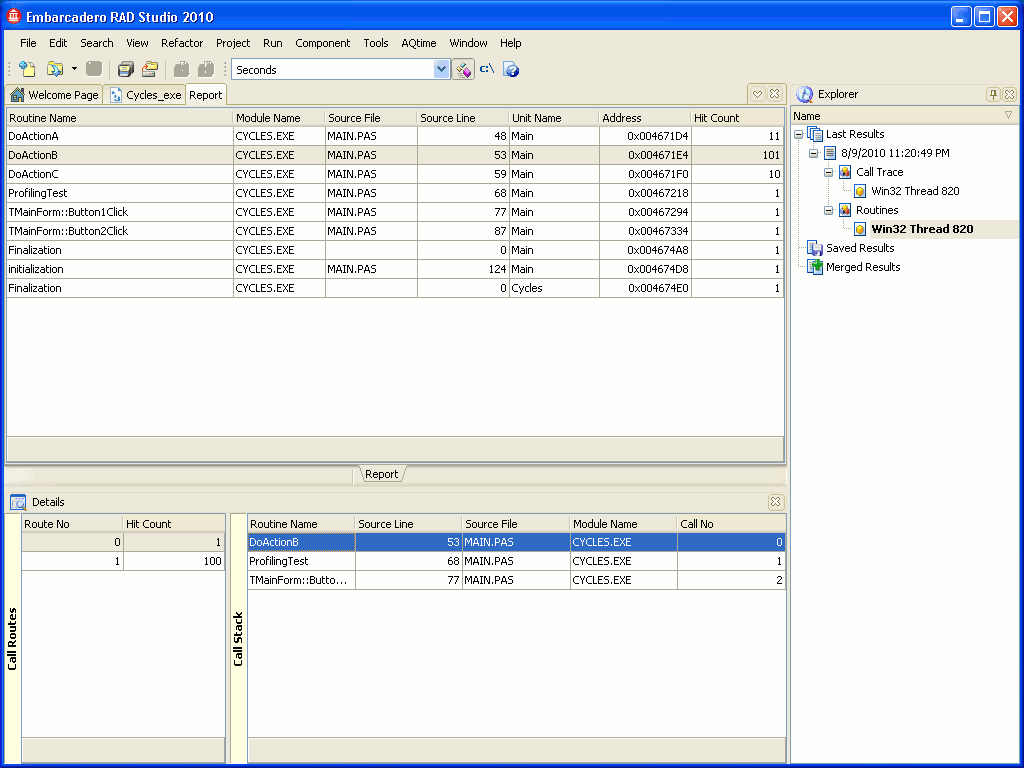
The Report panel columns display the routine name and other attributes, such as module name and hit count:
For more information on available columns, see Function Trace Profiler - Report Panel Columns.
Note that by default the Report panel does not show all available columns. To add columns to the panel, select the  Field Chooser from the context menu and then drag the desired column to the panel. See Adding and Removing Columns for more information.
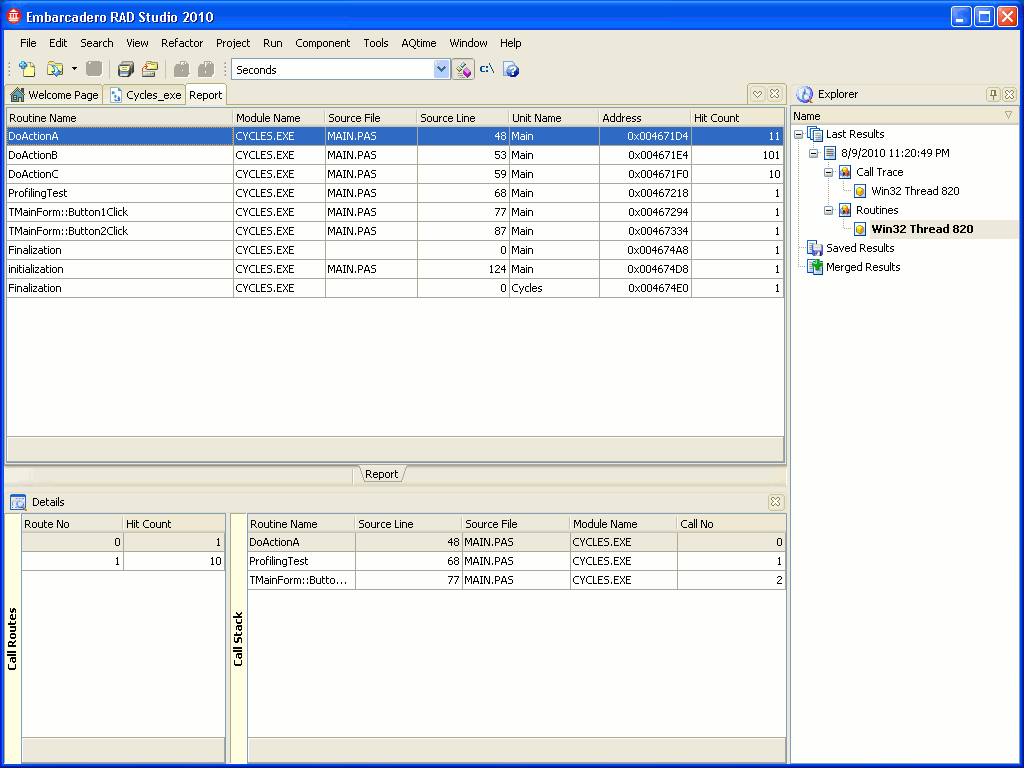
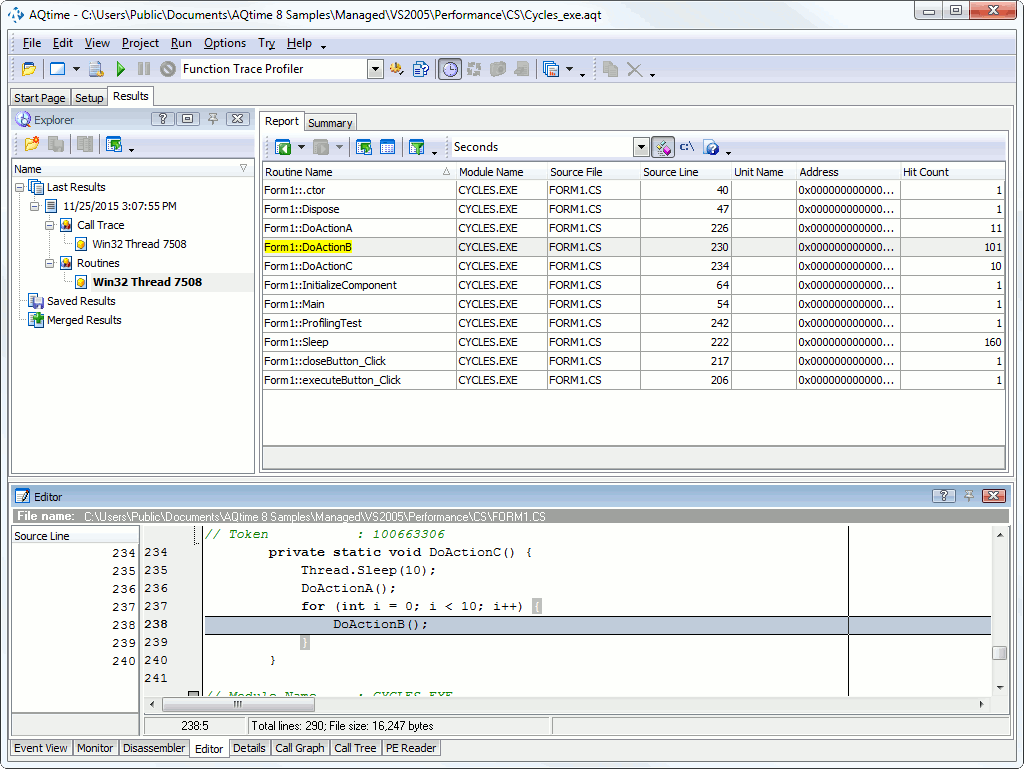
Let’s explore the calling routes for the DoActionB routine. To do this, we should first locate the routine in the Report panel. For this purpose, click somewhere within the Routine Name column of the Report panel and type the routine name (depending on the sample, it is Form1::DoActionB or DoActionB). AQTime will search while you are typing:
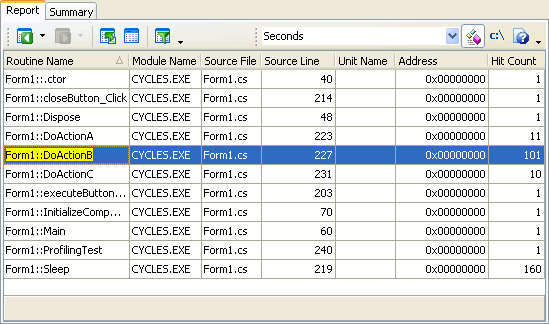
Double-click the DoActionB routine in the Report panel and switch to the Details panel. When the Routines category is selected, this panel displays the list of calling routes for the routine selected in the Report and the contents of each route.
As you can see, the DoActionB routine has two calling routes. They are shown in the Call Routes table of the Details panel. The Route No column displays the route index and the Hit Count column indicates how many times the route was used during the application execution:
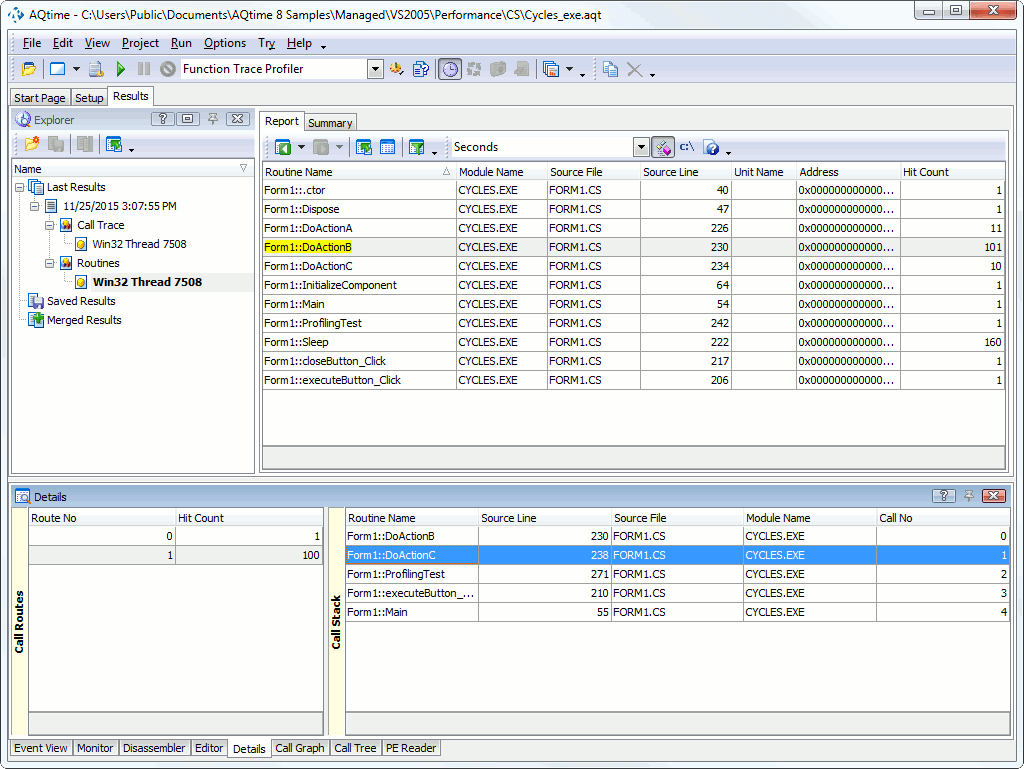
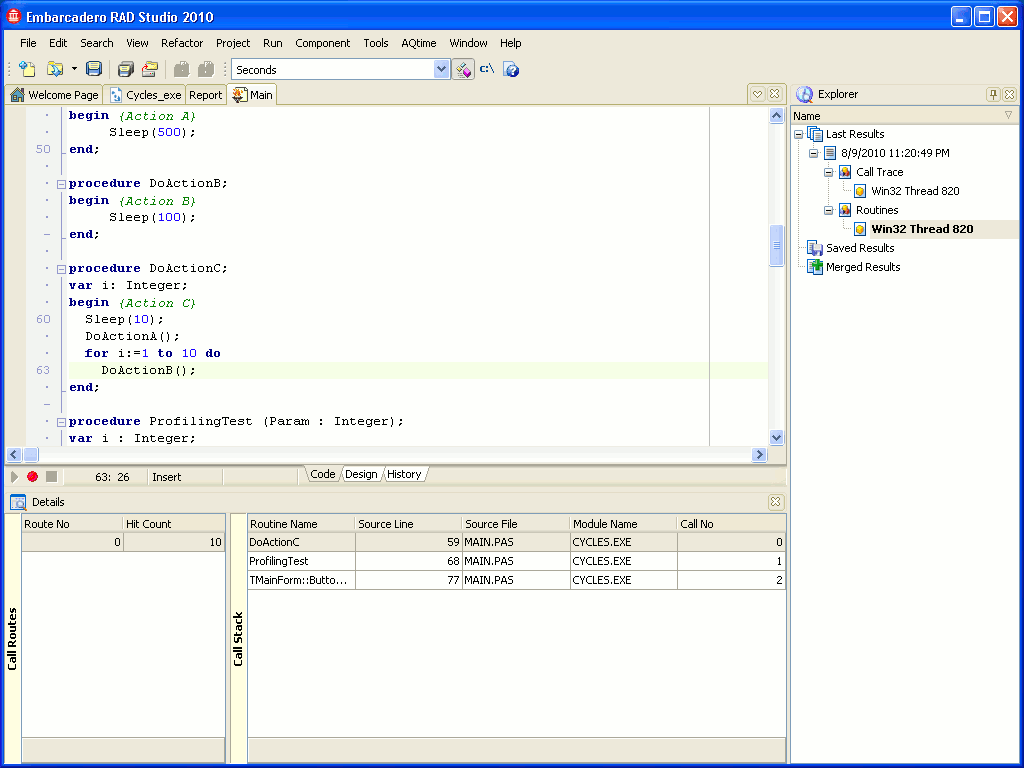
To view the sequence of function calls that make up a route, simply select the desired route in the Call Routes list and look at the Call Stack pane (by default, it is on the right of the Call Routes).
The Call Stack table contains information about function calls that lead to the call of the selected routine. the table columns provide information about the routine: class name, source file, source line, module name. The Call No column indicates the order of the call. The topmost row (Call No = 0) corresponds to the selected routine (in our example it is DoActionB). The second row (Call No = 1) corresponds to the routine that called DoActionB (in our example it is DoActionC or Form1::DoActionC).
By default, the Call Stack does not support sorting, so you always see the routines in their call order. You can change the default settings in the Format Columns dialog. To invoke it, right-click somewhere within the Call Stack pane and choose Format Columns from the context menu.
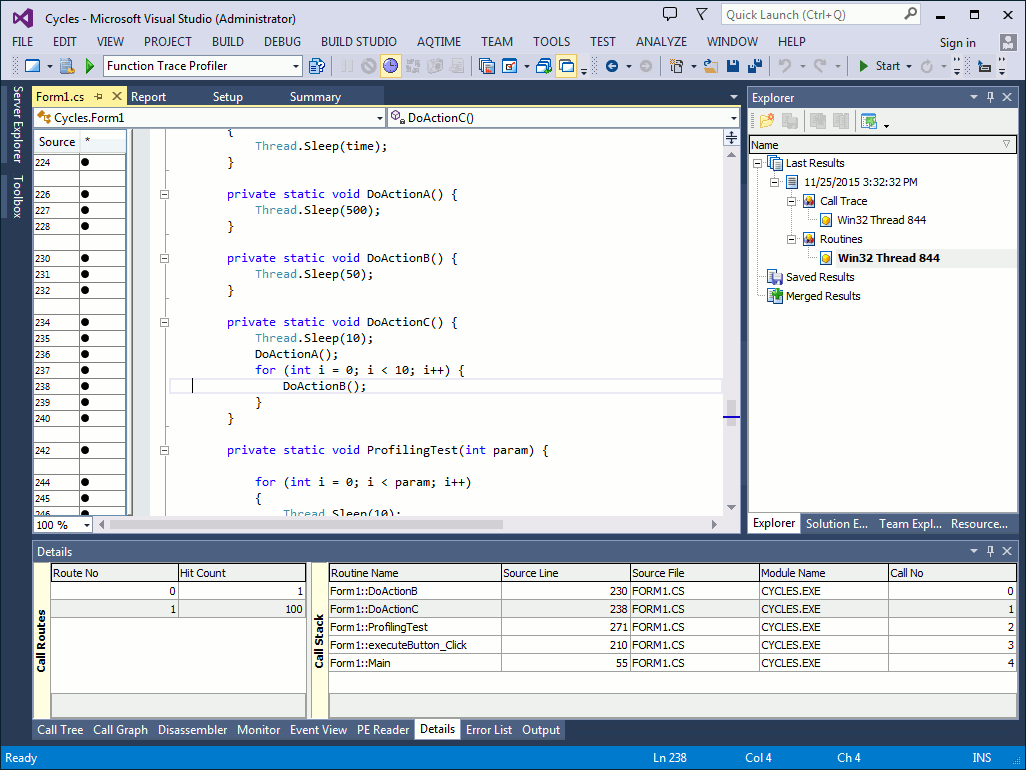
To view source code of the DoActionC routine, simply double-click it in the Call Stack and switch to the Editor panel. Within the Editor, you can easily find the source line holding a call to the DoActionB routine:
At the next step we will learn how to obtain the parameters of method calls.

 Prev
Prev