Besides tracing call routes, the Function Trace profiler can measure the duration of function calls and log the actual values of function parameters. In order to gather information on function parameters, the function must belong to a profiling area whose Retrieve parameter values property is enabled. That is why, in the second step, we created an area and added the main form class to it. Let’s explore the obtained parameters.
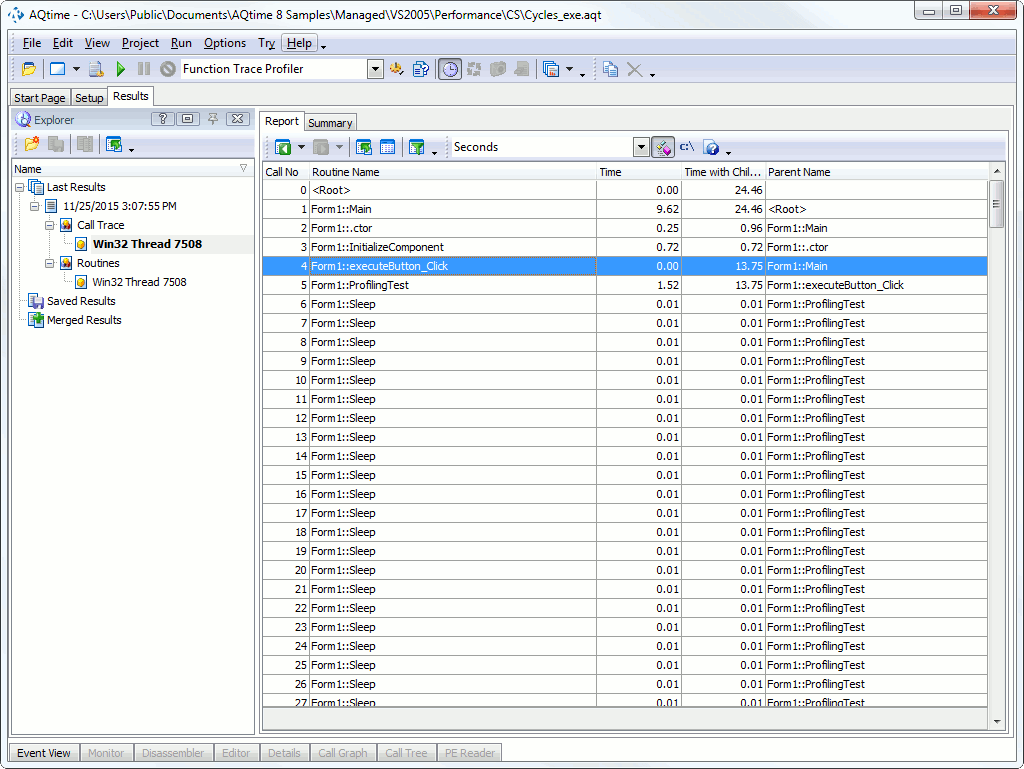
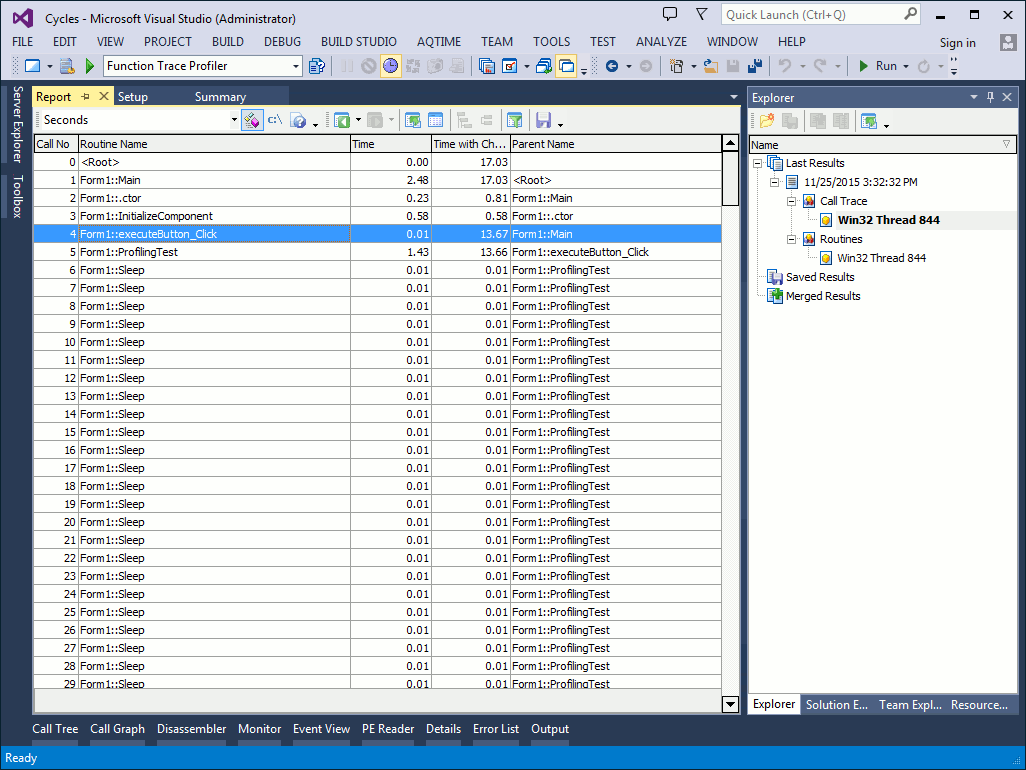
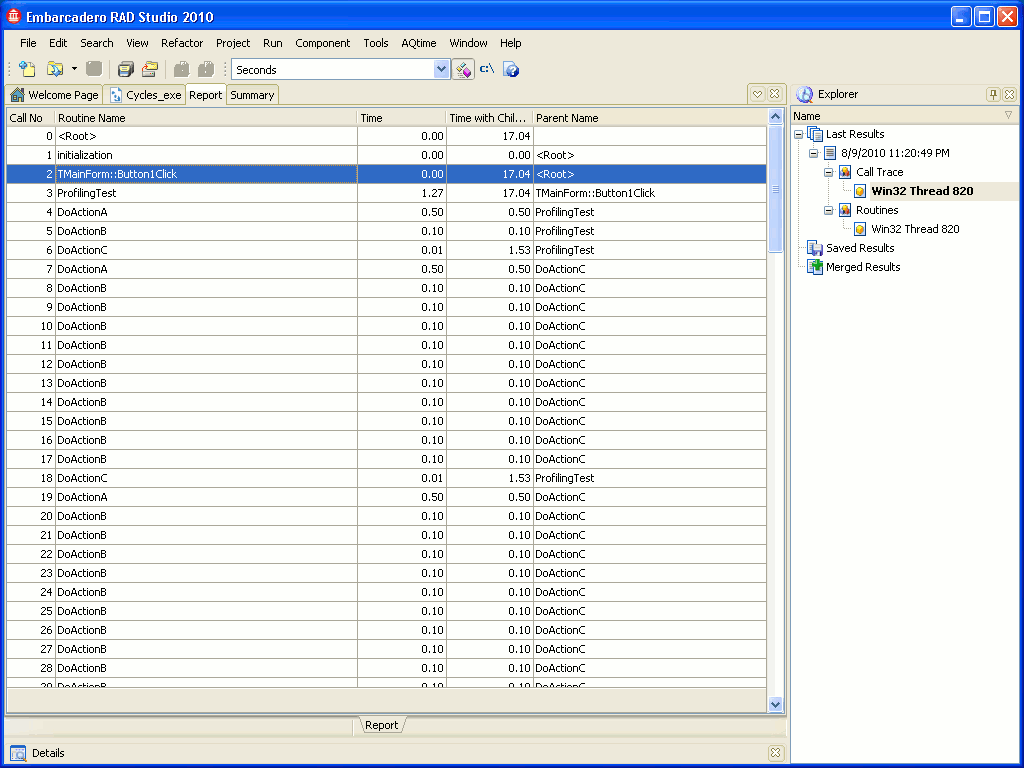
Select a thread node under the Call Trace category in the Explorer panel and switch to Report. The Report panel displays the sequence of function calls for the selected thread:
As you can see, each row in the Report panel corresponds to a single function call. The Call No column indicates the call index. The Time and Time with Children column shows the execution time of the function call.
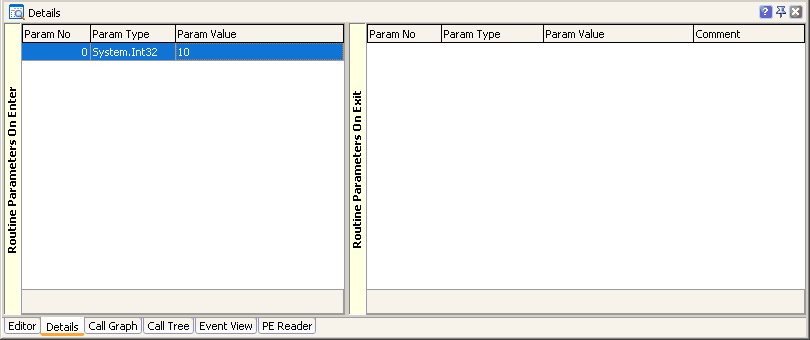
Find the ProfilingTest function in the Report panel, double-click the function name and switch to the Details panel. It will show the list of function parameters. For each parameter it displays the type, size in memory, as well as the parameter values passed to the routine for the call:

Note that information shown in the Details panel is call-specific, not function-specific. For instance, if the ProfilingTest routine were called several times, the routine would be included several times in the Report panel and the Details panel would display parameter values specific for the call that is selected in Report.


 Prev
Prev