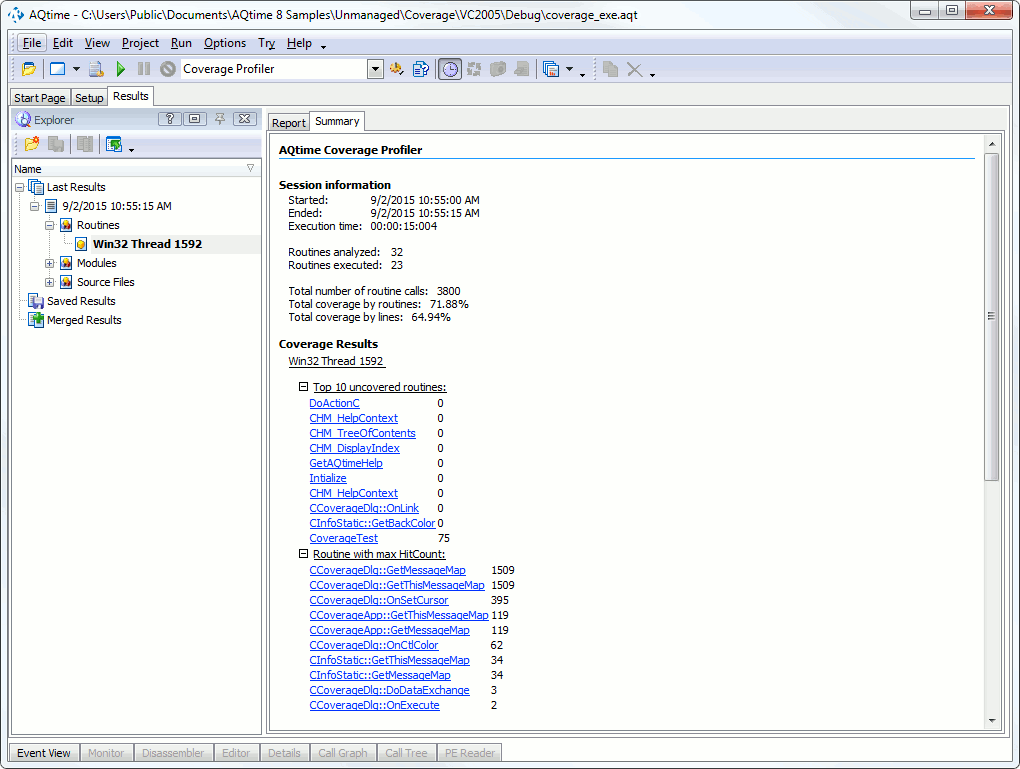
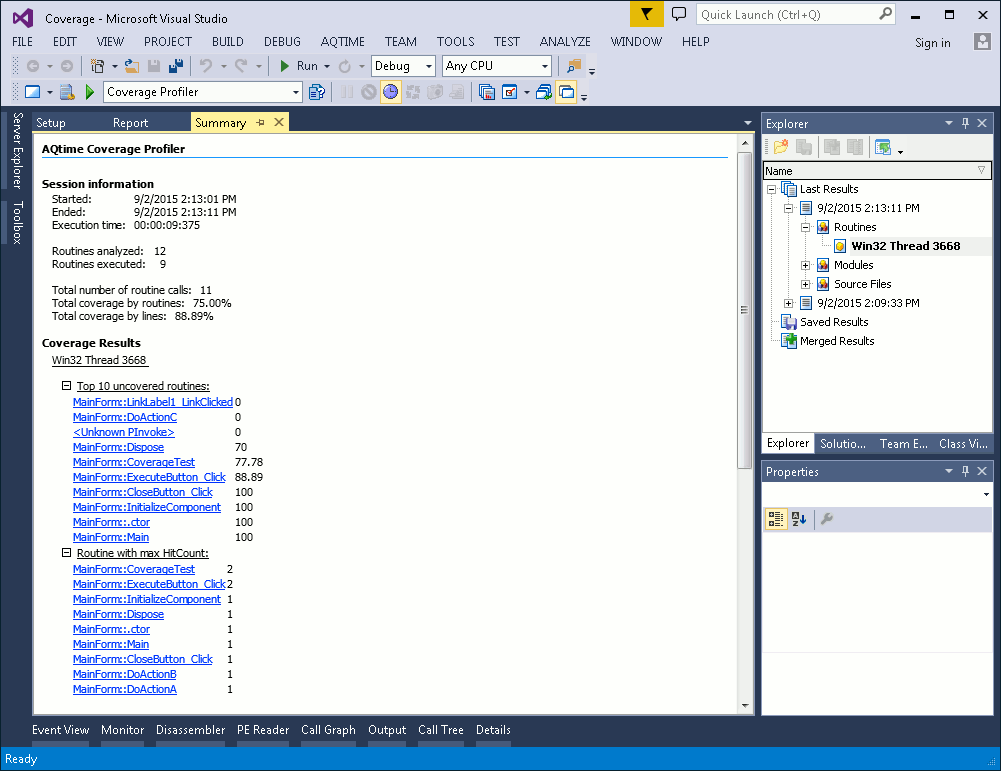
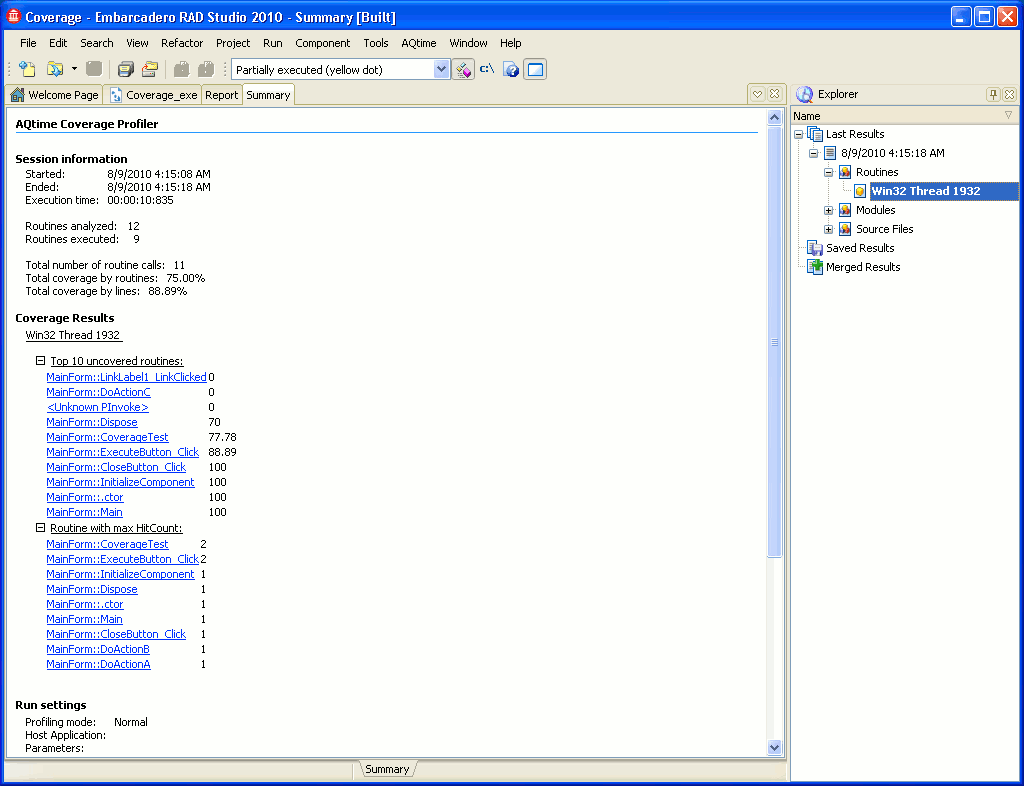
Switch to the Summary panel. It will tell you how many routines were analyzed (in our case we selected All Project Modules (Collect info about lines), so these are all the routines called by our sample), the number of routines that were executed and the number that were not, the percentage of routines that were run against all routines selected for profiling (total routine coverage) as well as the percentage of source code lines that were run against all lines selected for profiling (total line coverage). Also, the panel will list 10 routines that are called most often and 10 routines that are called least often.
The Coverage profiler results are organized into three categories:
- Routines
- Source Files
- Modules
You can view the categories in the Explorer panel:
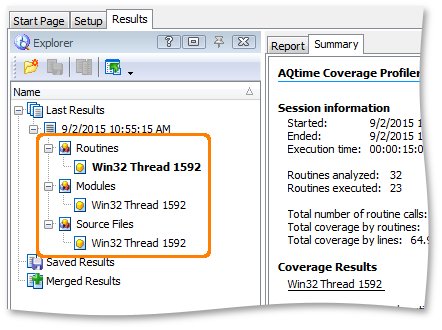
As you can see, within each category the results are grouped by threads. The profiler can collect results for Windows, CLR or COM threads. The collection mode is specified by the Thread model option. For more information on this, see Profiling Multiple Threads).
The results also contain the All threads node that contains the results for all profiled threads.
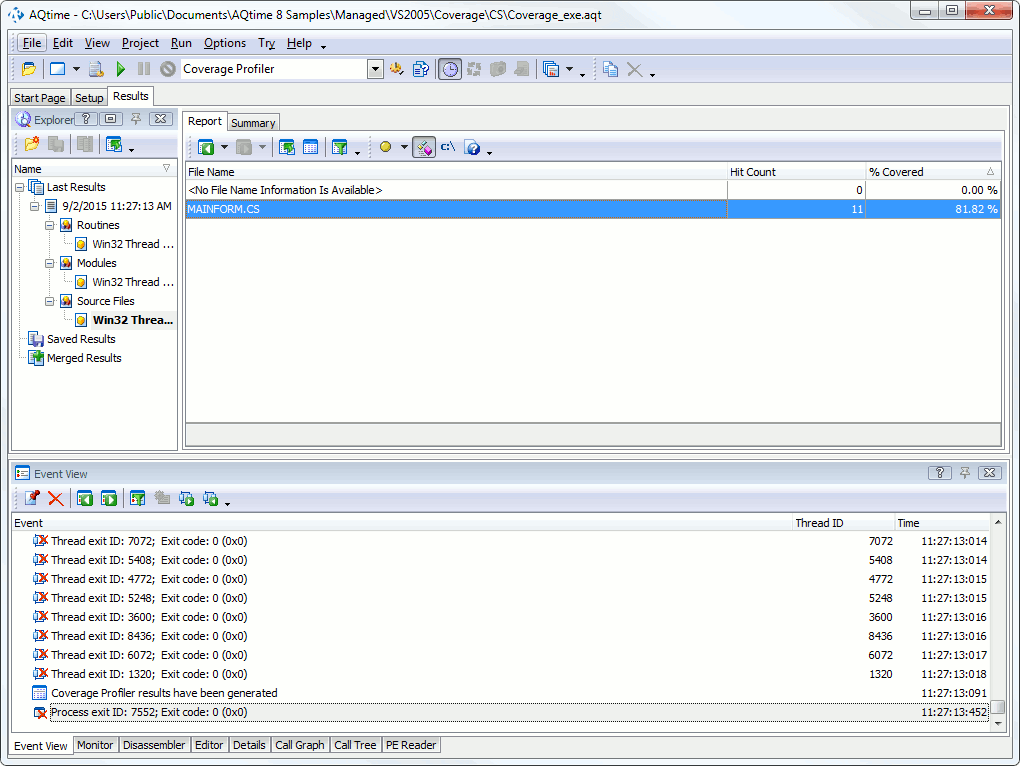
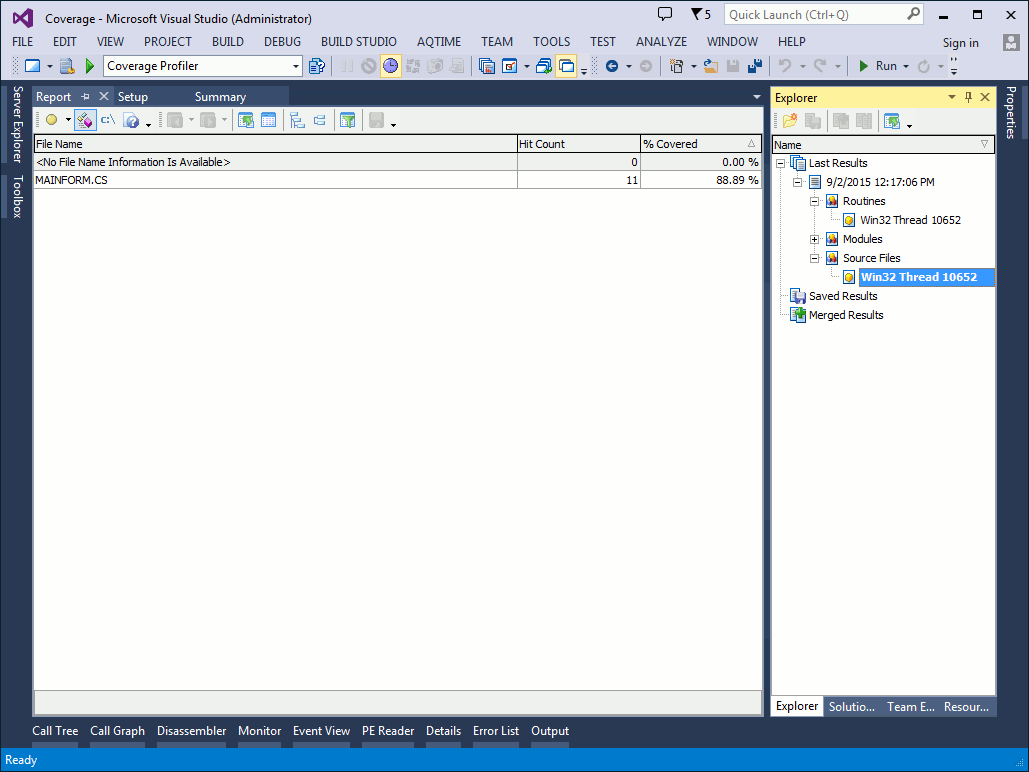
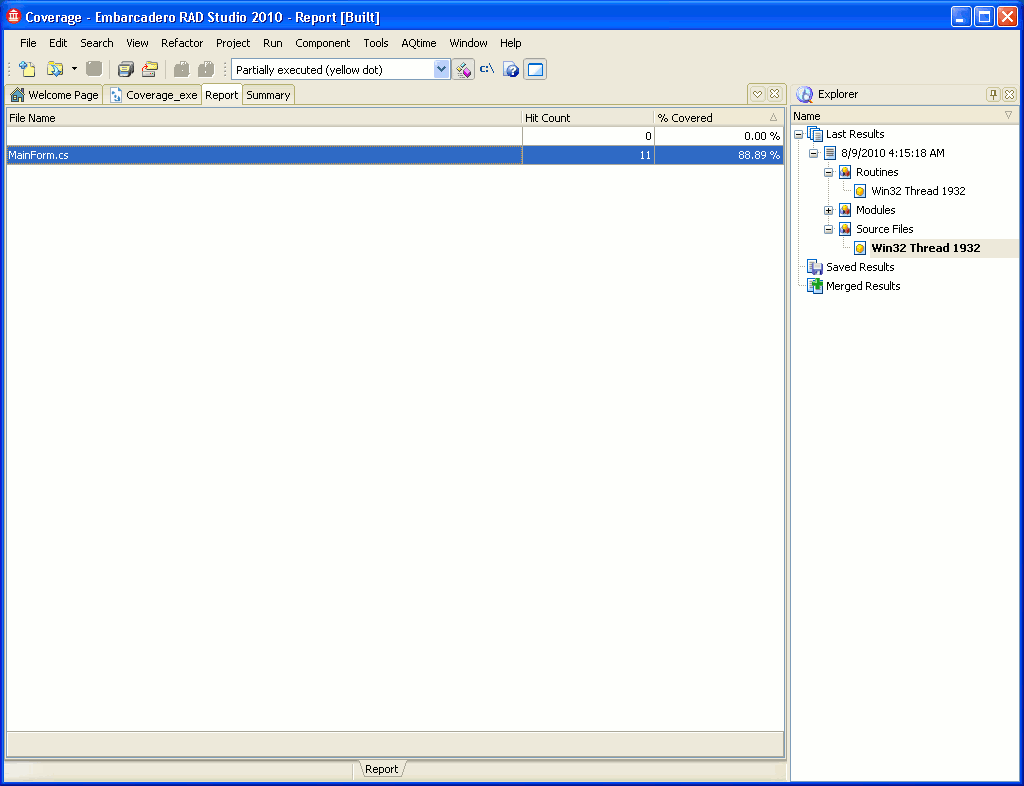
The data shown in the Report panel depends on the selected category. For instance, to view the coverage results for a source file, choose the Source Files category and any subnode under it. The Report panel will display the coverage results for source files, whose code was executed during the run:
Note that AQTime reads information about the source file name from the application’s debug info. If debug information does not contain the file name, the File Name column is empty.
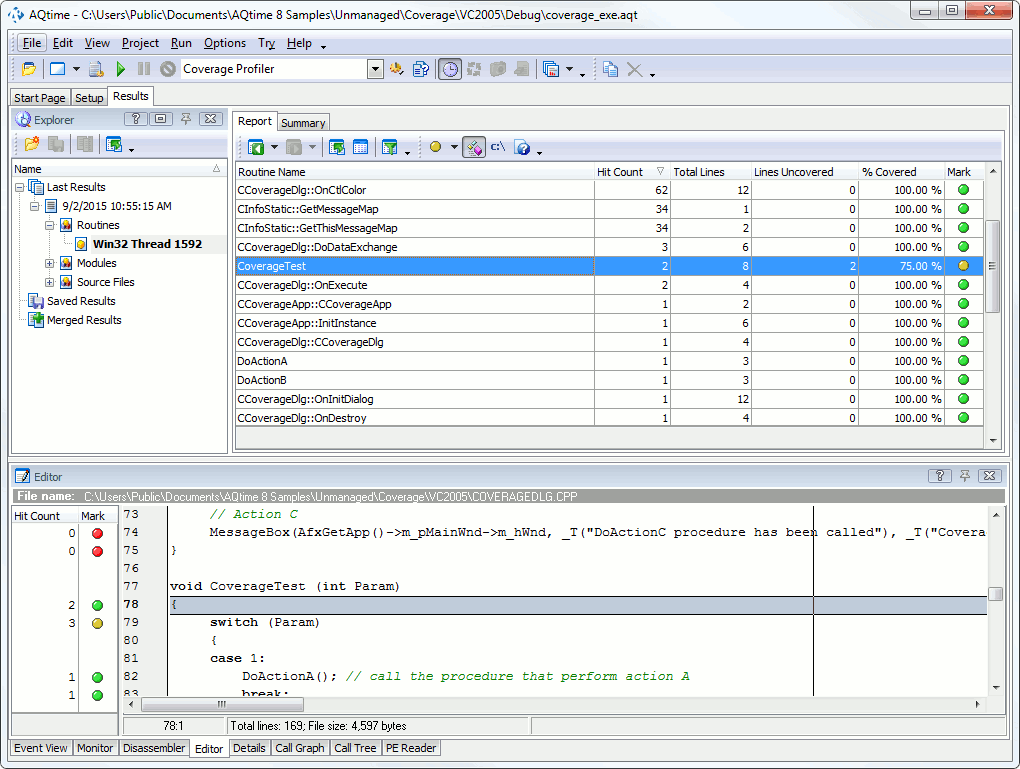
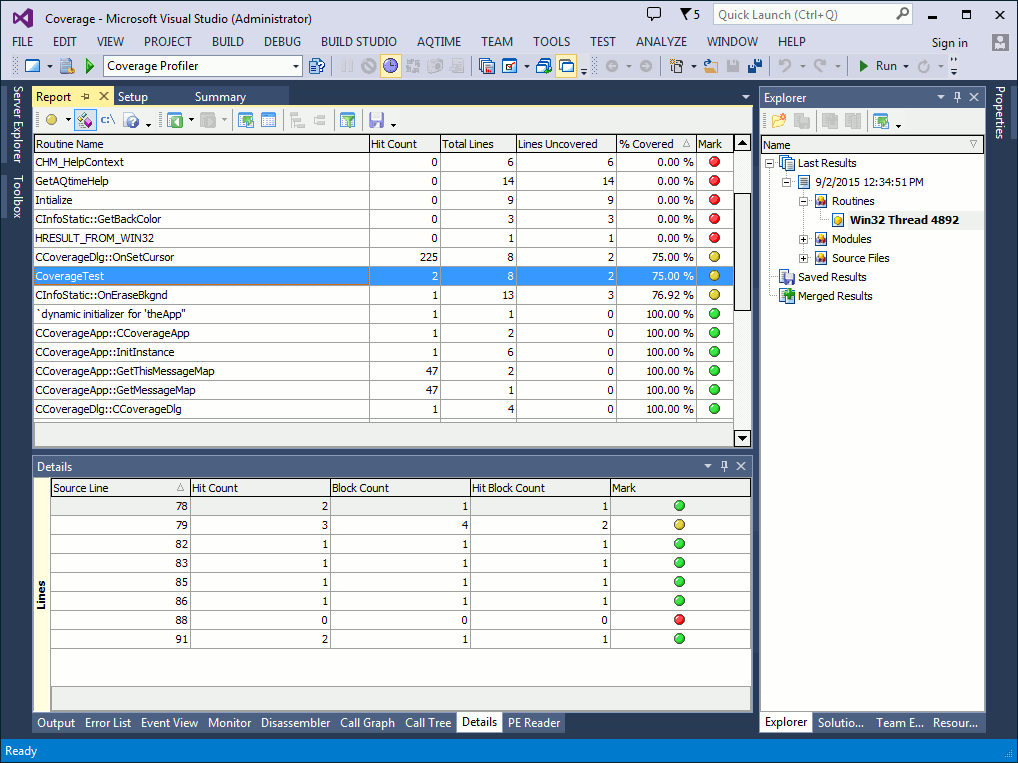
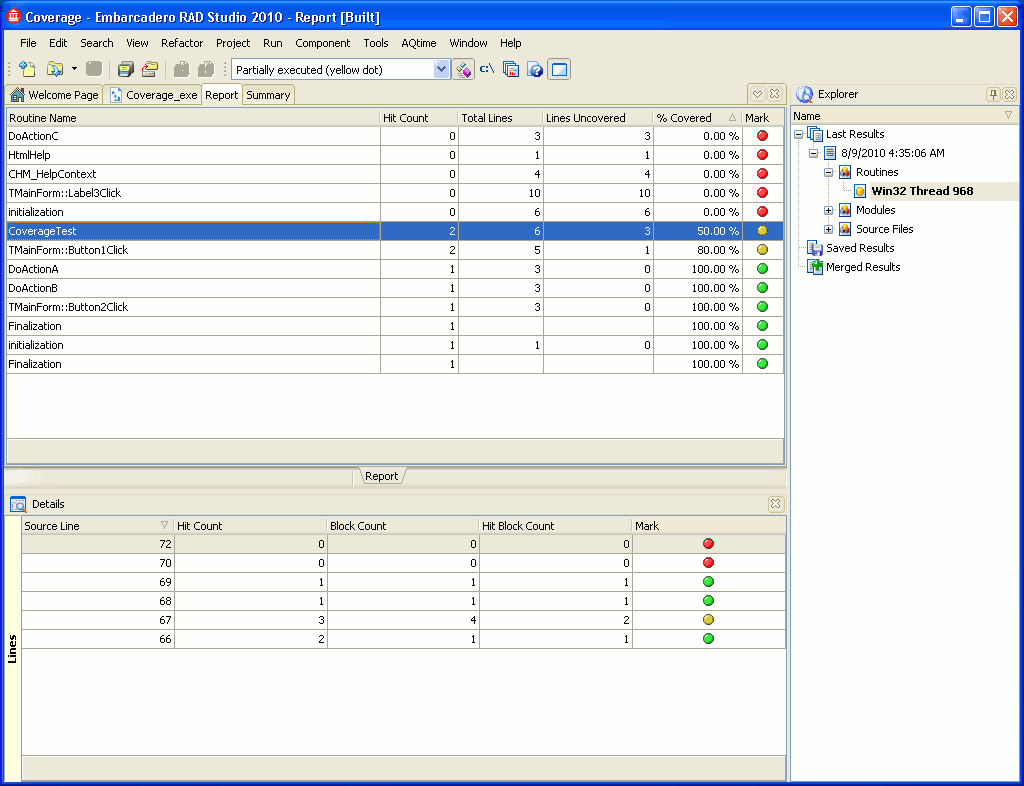
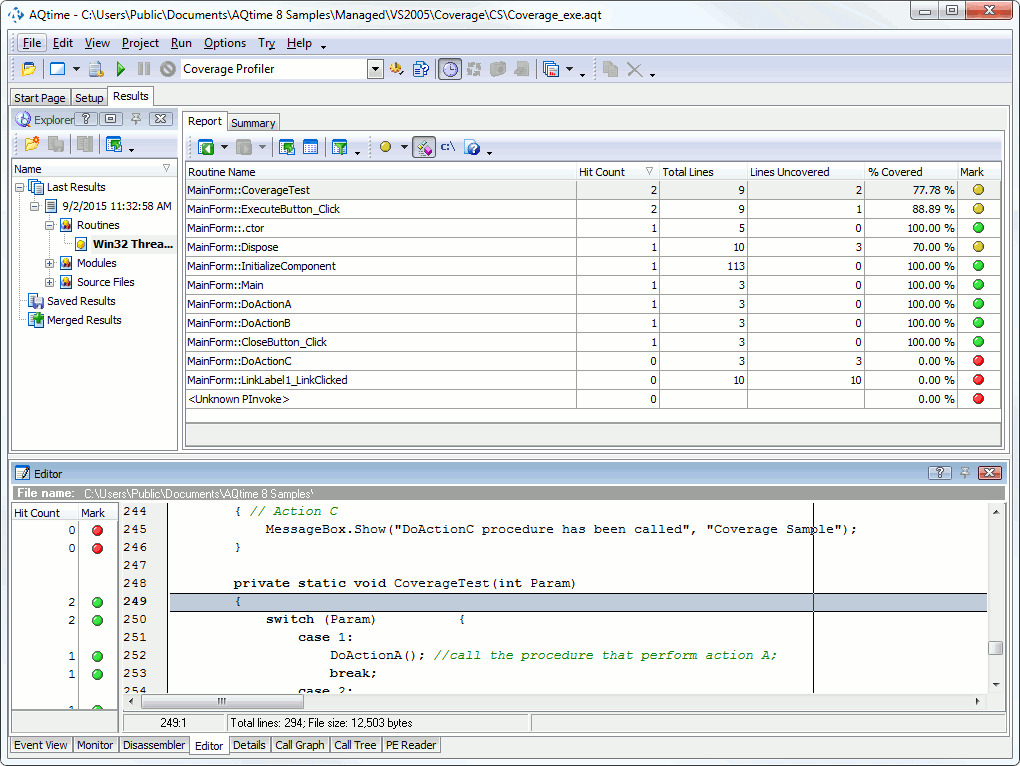
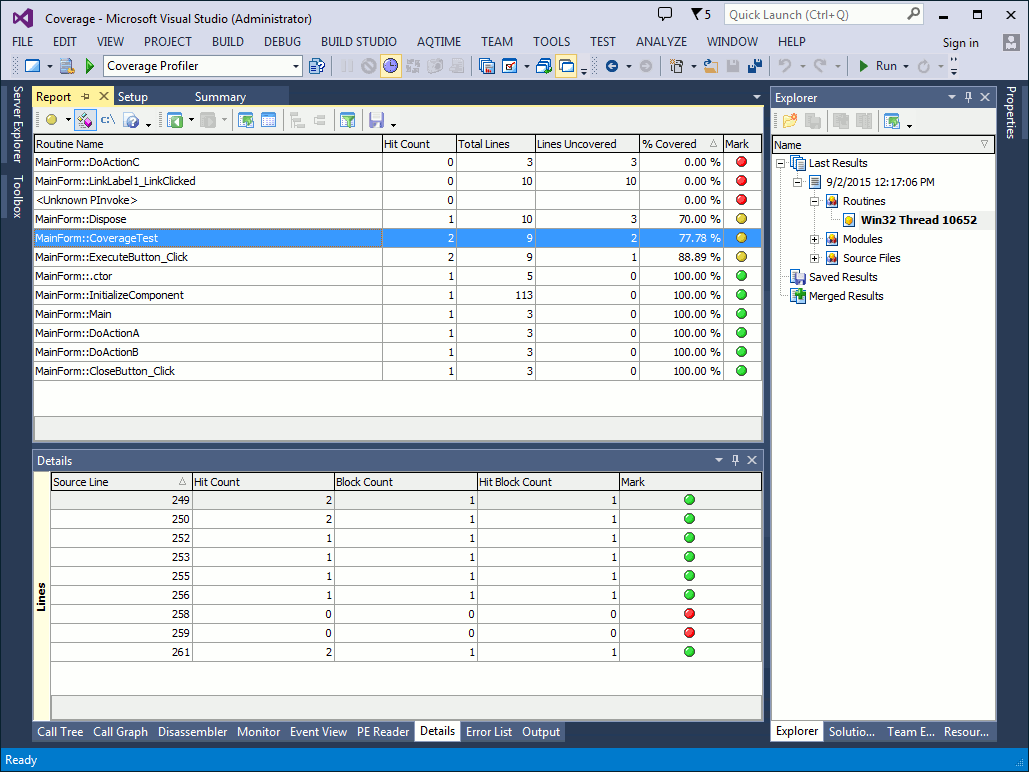
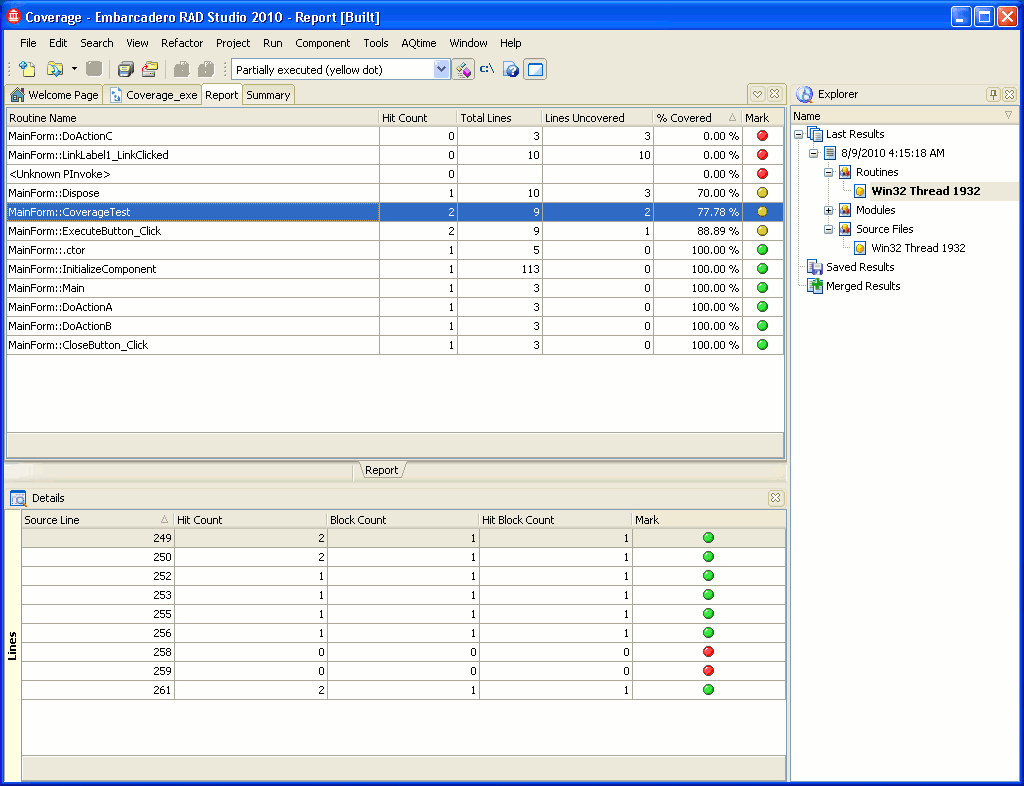
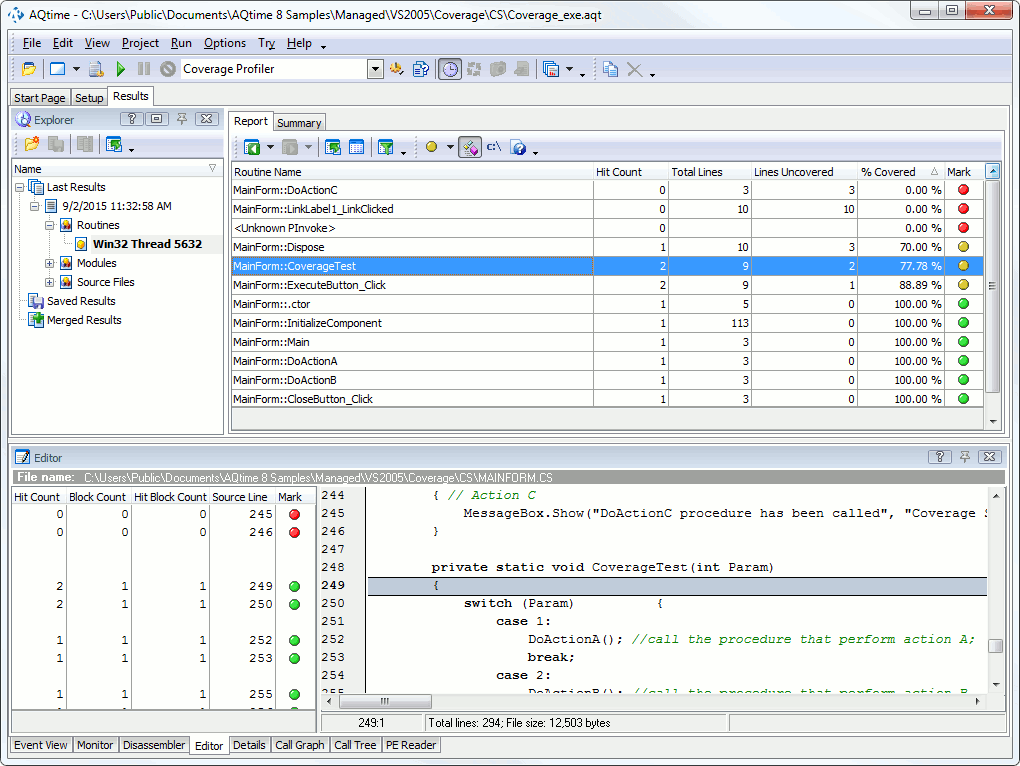
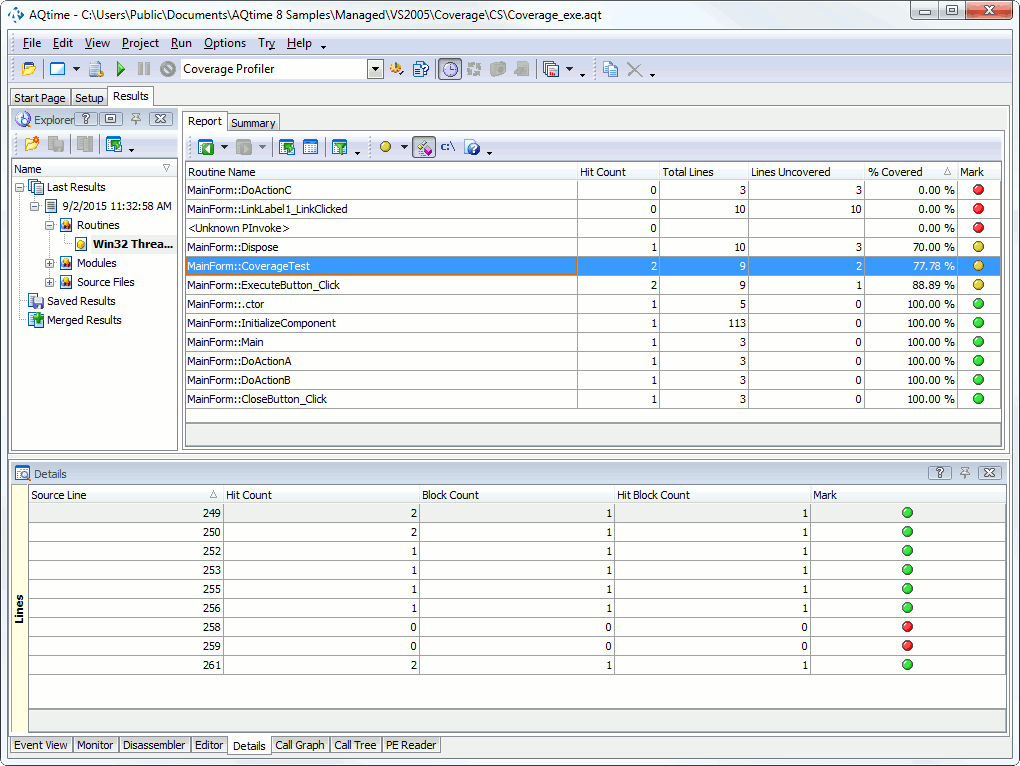
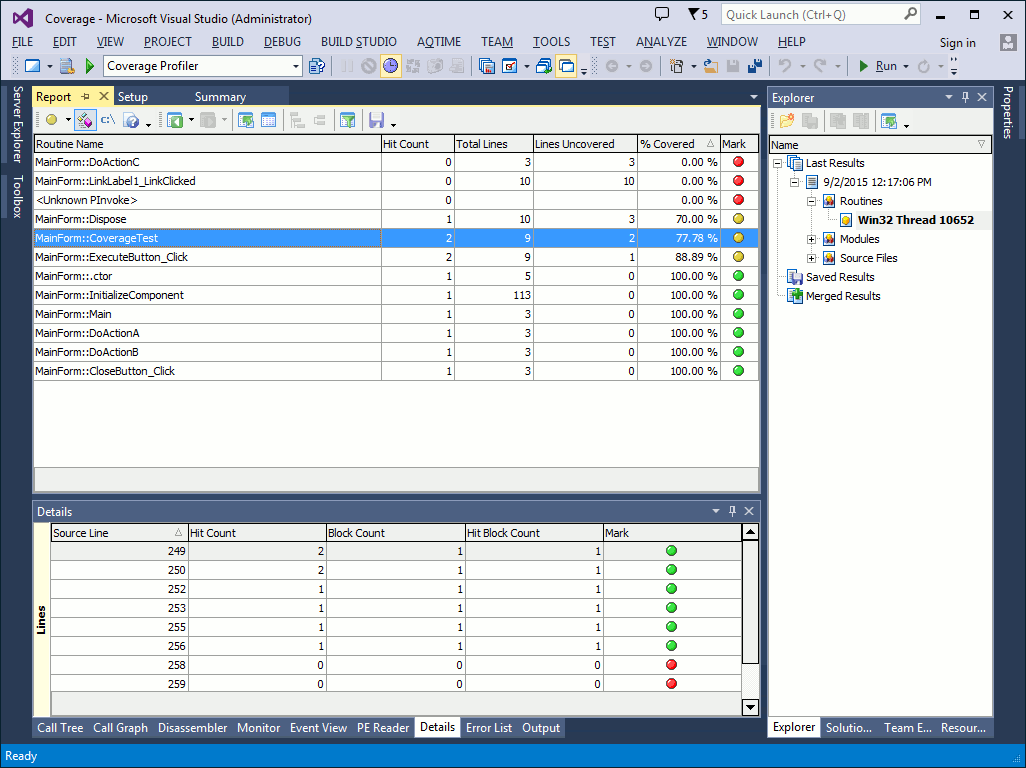
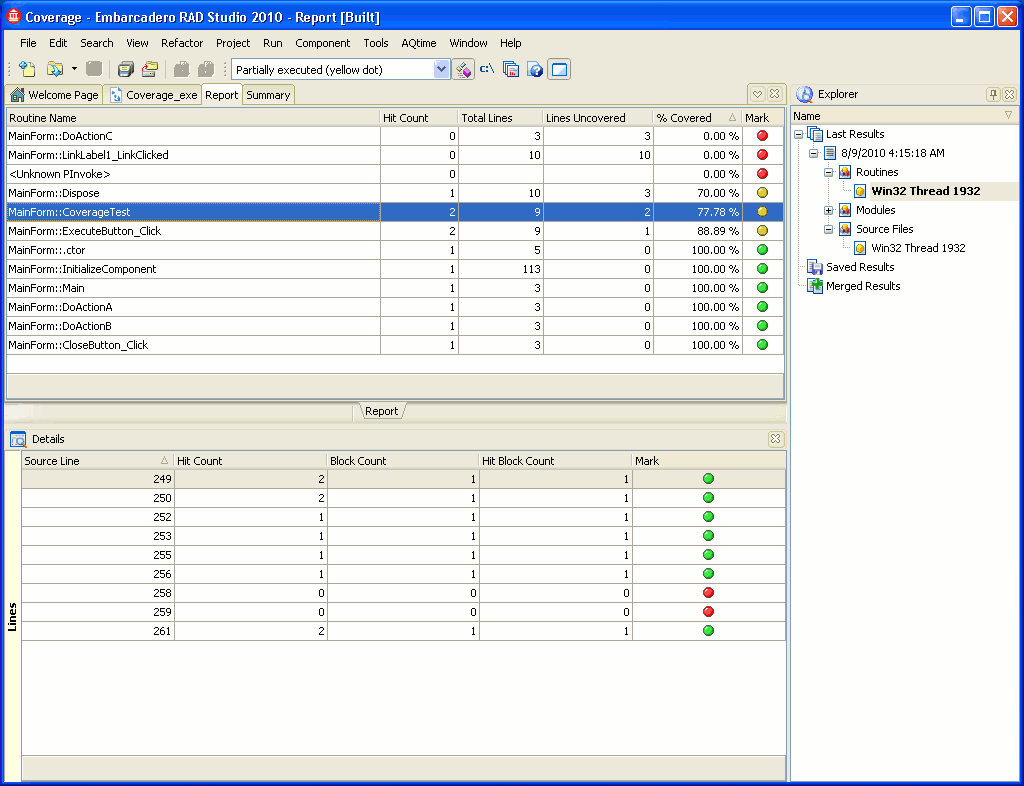
To view profiling results generated for routines and lines, choose the Routines category in the Explorer panel. The Report panel will tell you which routines executed. Its Hit Count column hold a non-zero value for the covered (called) routines and 0 for those not called. The Mark column shows the same information graphically, with a green dot for routines in which all lines were executed, a red dot for those routine in which no line was executed and a yellow dot for routines that were executed partially.
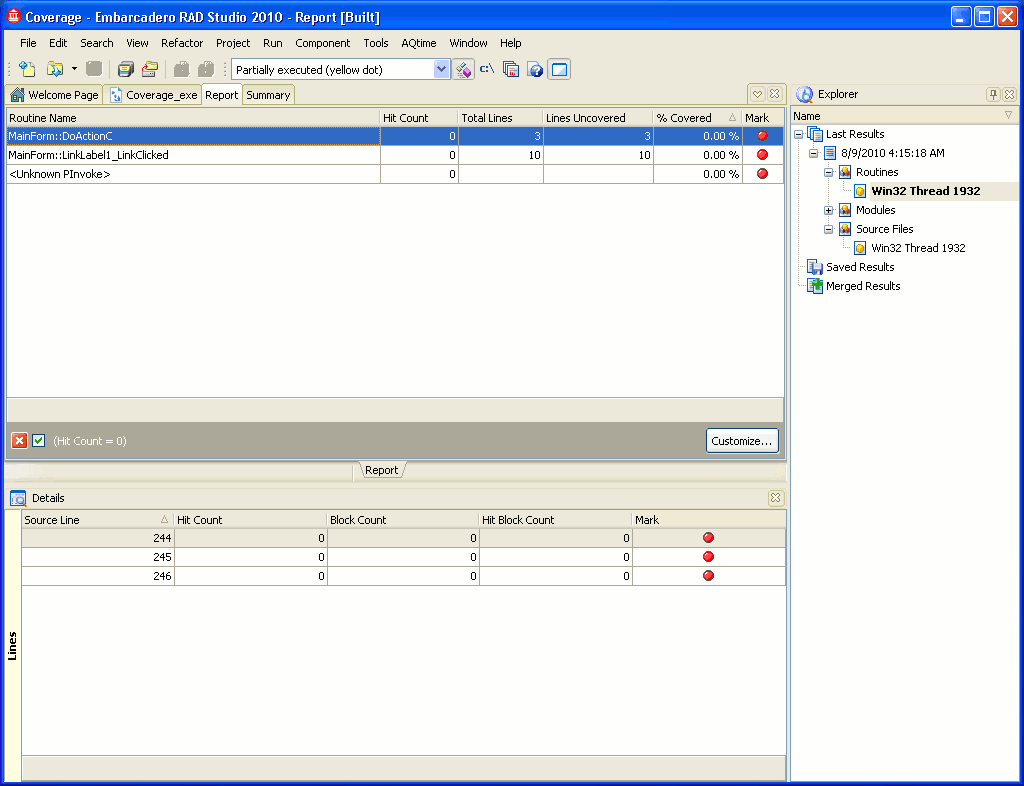
Here is what we got for an unmanaged implementation of our sample:
For a managed implementation of our sample, we can get profiling results like the following:
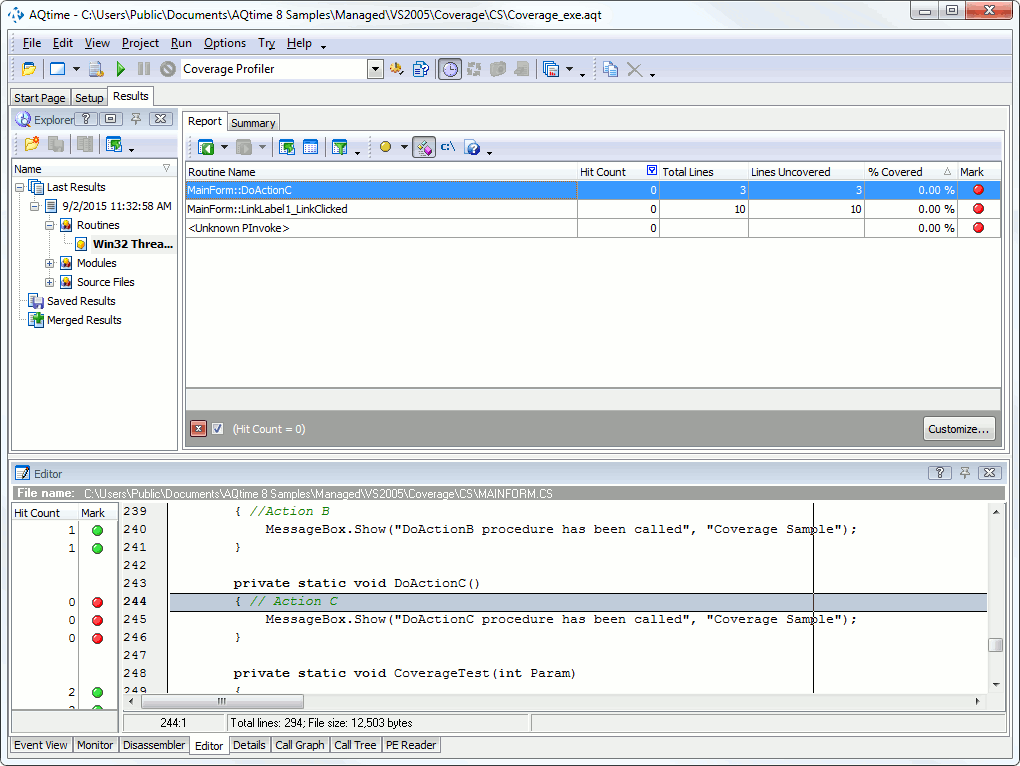
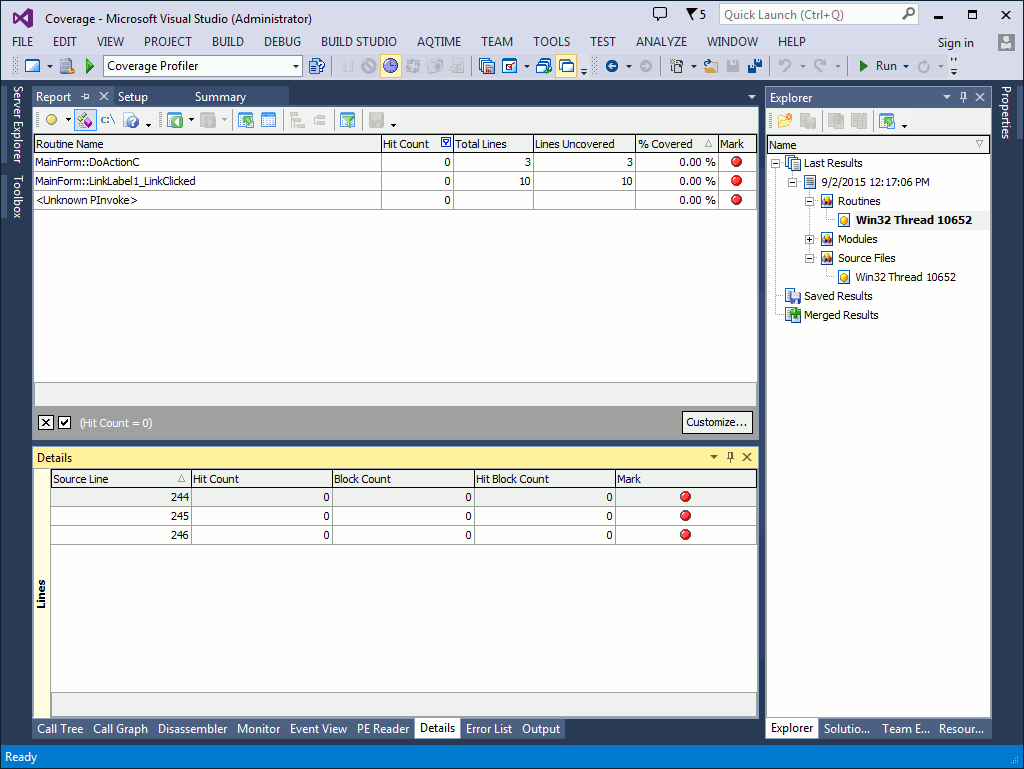
You can easily isolate called or not called routines if you apply an appropriate filter to the results in the Report panel. To get the list of uncovered routines, you can also select the predefined view Unexecuted routines only from the Views dropdown list on the Standard toolbar or from the Views dialog.
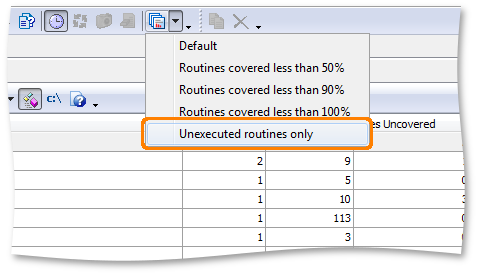
The Report panel will display filtered results:
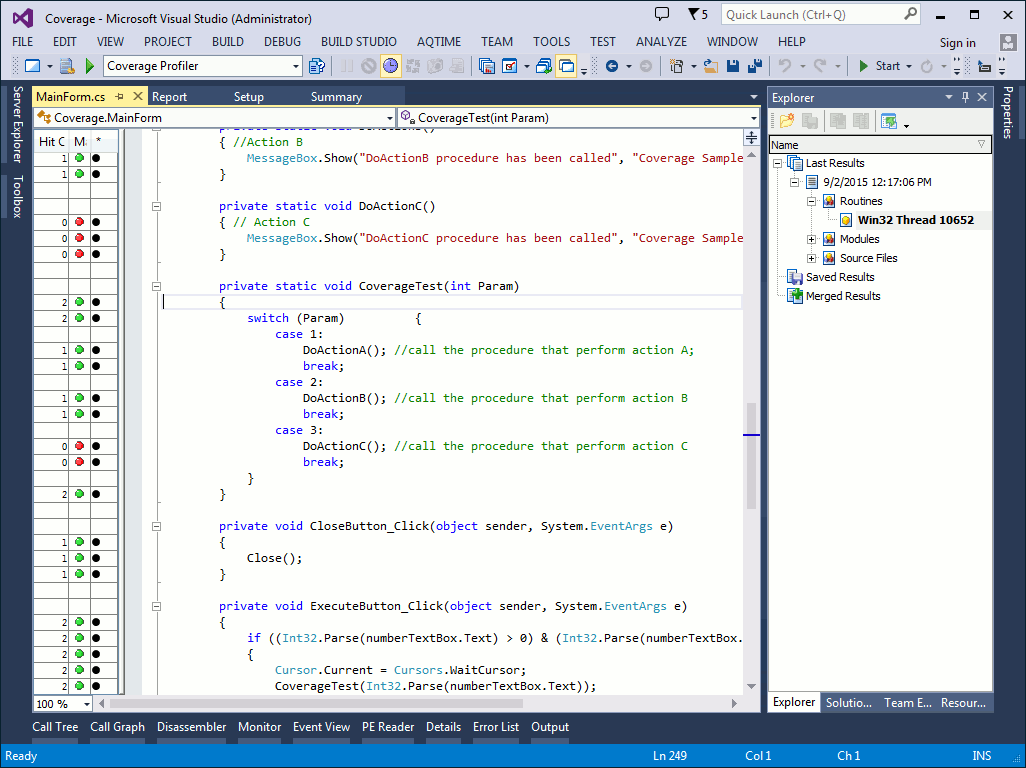
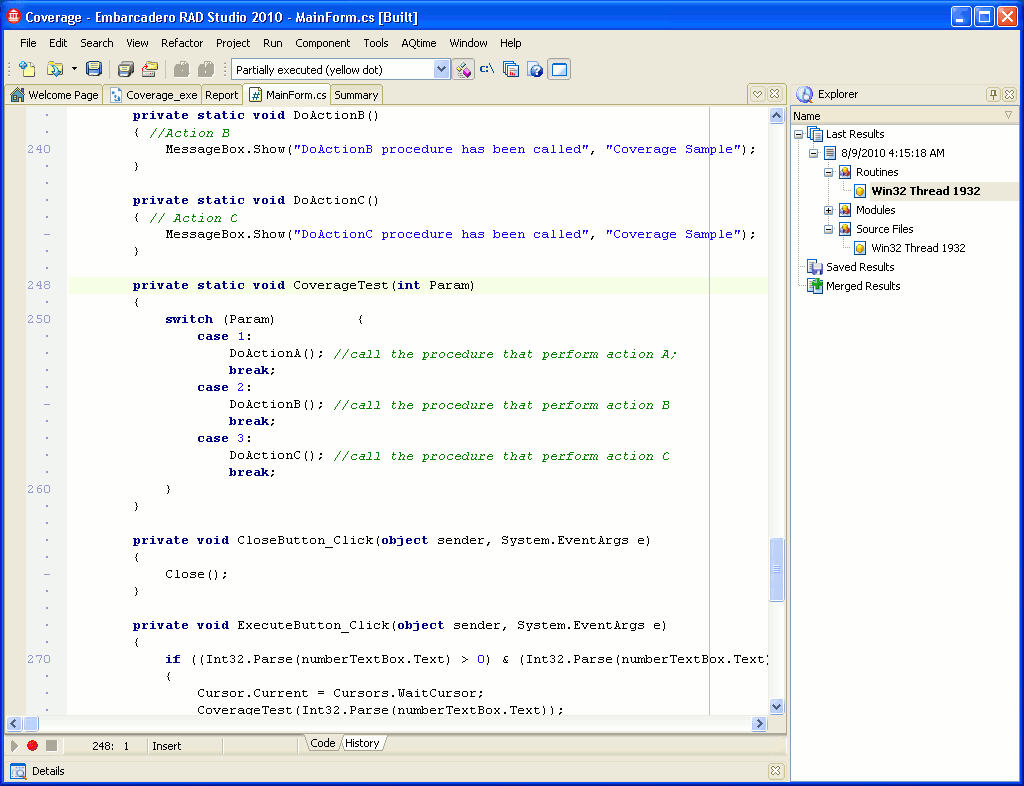
If you want to look at the source of the routine analyzed, double-click this routine in the Report panel and switch to the Editorclick it in the Report panel, select Show Source File from the Edit menu and switch to Visual Studio’s Code Editordouble-click this routine in the Report panel and switch to Embarcadero RAD Studio’s Editor. (The link to source code is available only if your application was compiled with debug information. See How AQTime Profilers Use Metadata and Debug Information. Also, the path to source files must be specified in the Project Search Directories or Search Directory dialog.)
 |
The Code Editor of Visual Studio lets you collapse and expand blocks of source code. The grid, which AQTime adds to the Code Editor to display profiling results, supports neither collapsing, nor expanding, because Visual Studio does not send appropriate notifications to AQTime. So, to ensure that the grid shows proper profiling results for source lines and routines, please expand all the collapsed blocks of code. To do this, use the Outlining > Toggle All Outlining or Outlining > Stop Outlining item of the Code Editor’s context menu. |
 |
The Editor of Embarcadero RAD Studio lets you collapse and expand blocks of source code. The grid, which AQTime adds to the Editor to display profiling results, supports neither collapsing, nor expanding, because Embarcadero RAD Studio does not send appropriate notifications to AQTime. So, to ensure that the grid shows proper profiling results for source lines and routines, please expand all the collapsed blocks of code. To do this, use the Unfold > All item of the Editor’s context menu. |
Green and red dots in the grid have the same meaning as in the Report panel. A yellow dot means that a source code line includes several blocks some of which were not executed. Only routines that were added to a line-level area and for which there is a source code link were analyzed at the line level. As a result, the editor's grid displays green, red and yellow dots next to each source line (see the picture above). Even more, for each source line, you can learn how many times it was executed, how many blocks it has and how many blocks were executed. In addition, line profiling results are displayed on the Lines pane of the Details panel:
Note that Line Level profiling is available only if the application was compiled with the debug information. (See How AQTime Profilers Use Metadata and Debug Information).
The Report panel and the Editor's gridthe Code Editor’s grid support custom summary fields, which can help you, say, to view the total number of covered lines for the routines listed in Report. Also, if there are more than one record selected in any of these panels, the summary fields display information that corresponds to the selected records, rather than to all records.

 Prev
Prev