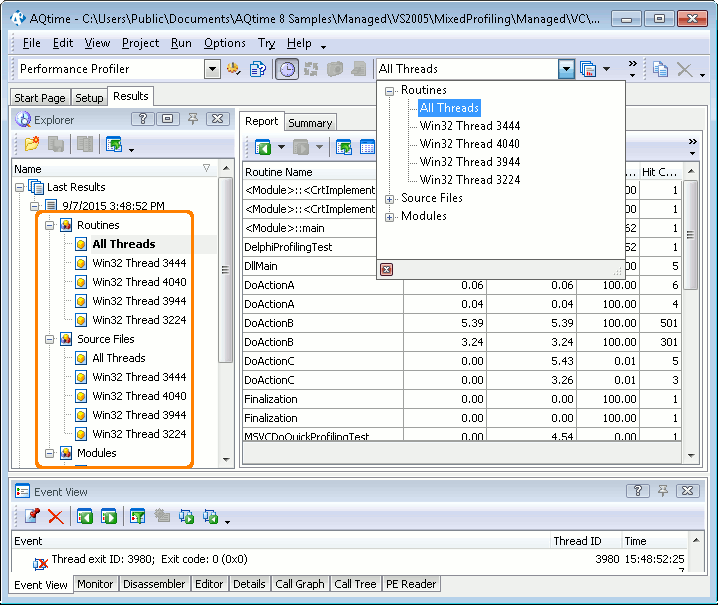
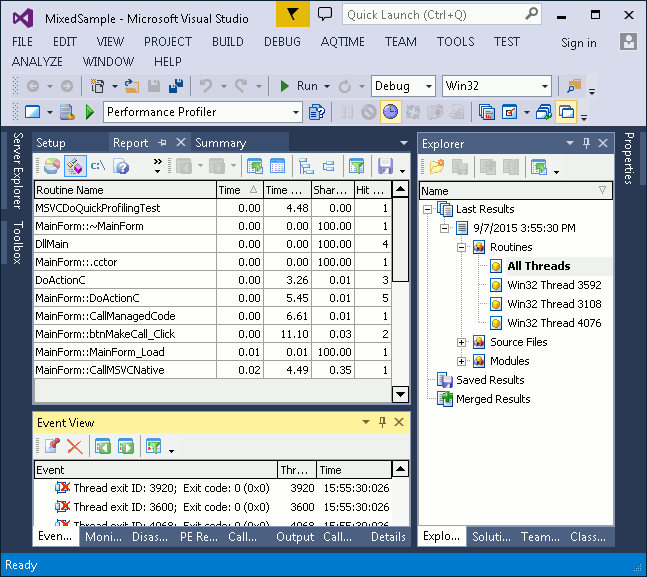
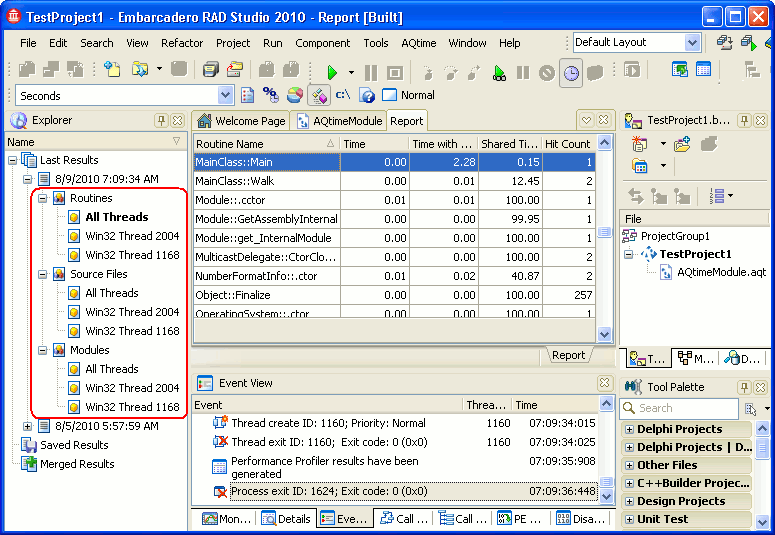
See how AQTime Pro organizes profiling results by threads:
| Collecting Results by Threads with AQTime |
AQTime profilers trace function calls in all application threads. This is quite transparent for the user and does not require special preparation for the application. However, to obtain correct profiling results and the stack of functions, you may need to assign certain values to the Thread model option of the selected profiler. This topic describes the thread profiling functionality of AQTime and describes why the option is needed.
AQTime’s Allocation, BDE SQL, Coverage, Function Trace, Performance, Reference Count, Resource and Sampling profilers log and save results by threads. If the profile run includes more than one thread, you can select a single thread to show in the Report panel from the Explorer panel or from the Result Items box. Of course, you can display all of threads together as well:


As you can see, threads are identified by their IDs. For .NET applications running under the .NET Framework version 2.0 or later, AQTime is able to obtain user-defined names of CLR threads that are assigned through the Name property of the Thread class (for more information, see the property description in the MSDN Library).
AQTime also lets you assign descriptive names to threads from your application. These names will be used instead of the default thread names in AQTime panels and toolbar items. As you can see on the picture above, one of the threads has a user-defined name. For more information, see Assigning Names to Threads.
The Performance and Coverage profilers can also be controlled by triggers, which turn profiling on or off for a particular thread in which a function (the trigger) runs. This is an essential tool to winnow out profile information from complex multithreaded applications.
Note that a thread is not a process. If a profiled application launches a new process, it will simply escape being profiled by AQTime, which can only watch over the child process it has launched itself (or to which it attached).
We would like to point out that the operating system threads differ from the managed threads that may exist in .NET applications. Managed threads are controlled by the common language runtime. It can create one or several operating system threads to run a single managed thread. AQTime profilers include the Thread model option that specifies what thread model the profiler should log the results. If you select the Win32 Threads value for this option, the Performance and Coverage profilers will group results by the operating system threads. The Function Trace, Allocation and Resource profilers will trace the stack of function calls by operating system threads. If you select CLR Threads, the profilers will gather results and trace the call stack by managed threads. The profiling results for these threads are displayed in the same way as results of the operating system threads: the Explorer panel holds a list of the threads (but these are not operating system threads, these are managed threads). You can view results for a thread by selecting this thread in the Explorer panel or in the Threads drop-down list.
There is one more value for the Thread model option: COM Threads. It means that AQTime should analyze logical threads that occur when a COM server works with several COM clients simultaneously. To keep this topic in bounds, we described these threads in a separate topic, Profiling COM Logical Threads.
By default, this item is hidden. To add it:
-
Right-click any AQTime toolbar and select Customize from the context menu.
-
In the Customize dialog, open the Commands tab and select the Standard category.
-
Drag the Result Items command to the desired toolbar and then close the dialog.
See Also
Profiling Multithreaded Applications
Assigning Names to Threads
Profiling COM Logical Threads
Performance Profiler Options
Coverage Profiler Options
