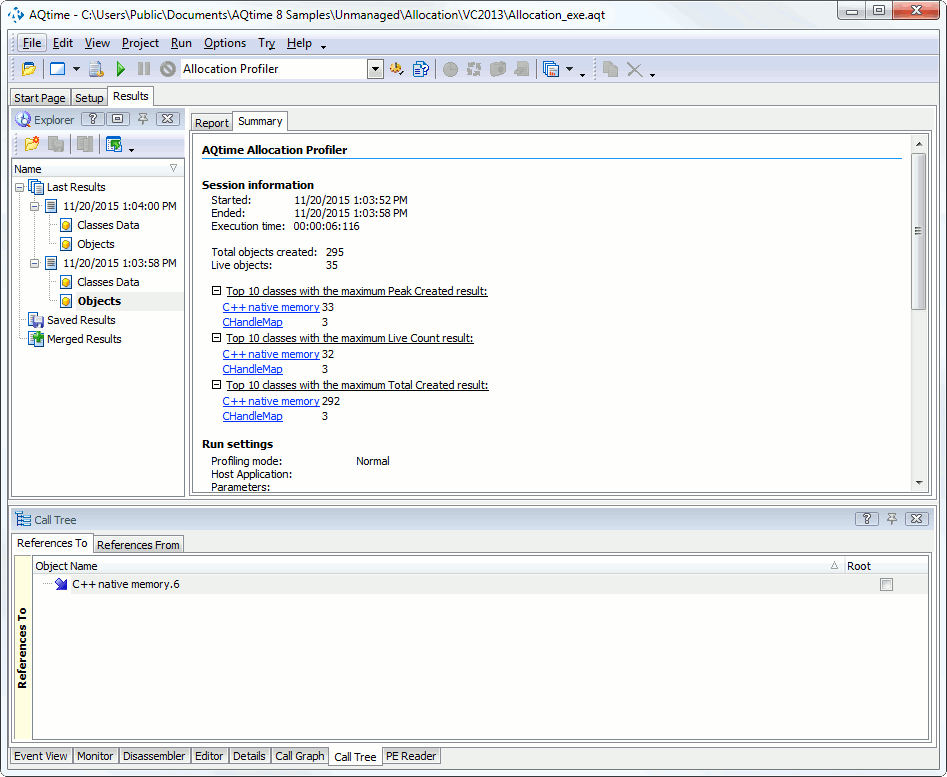
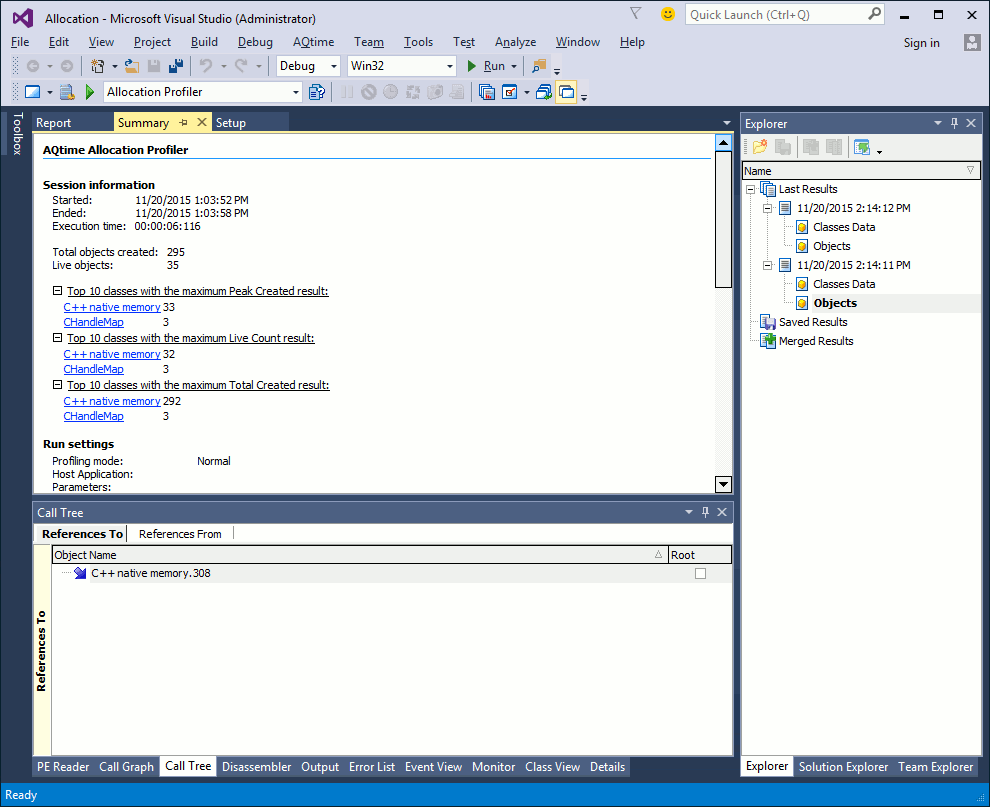
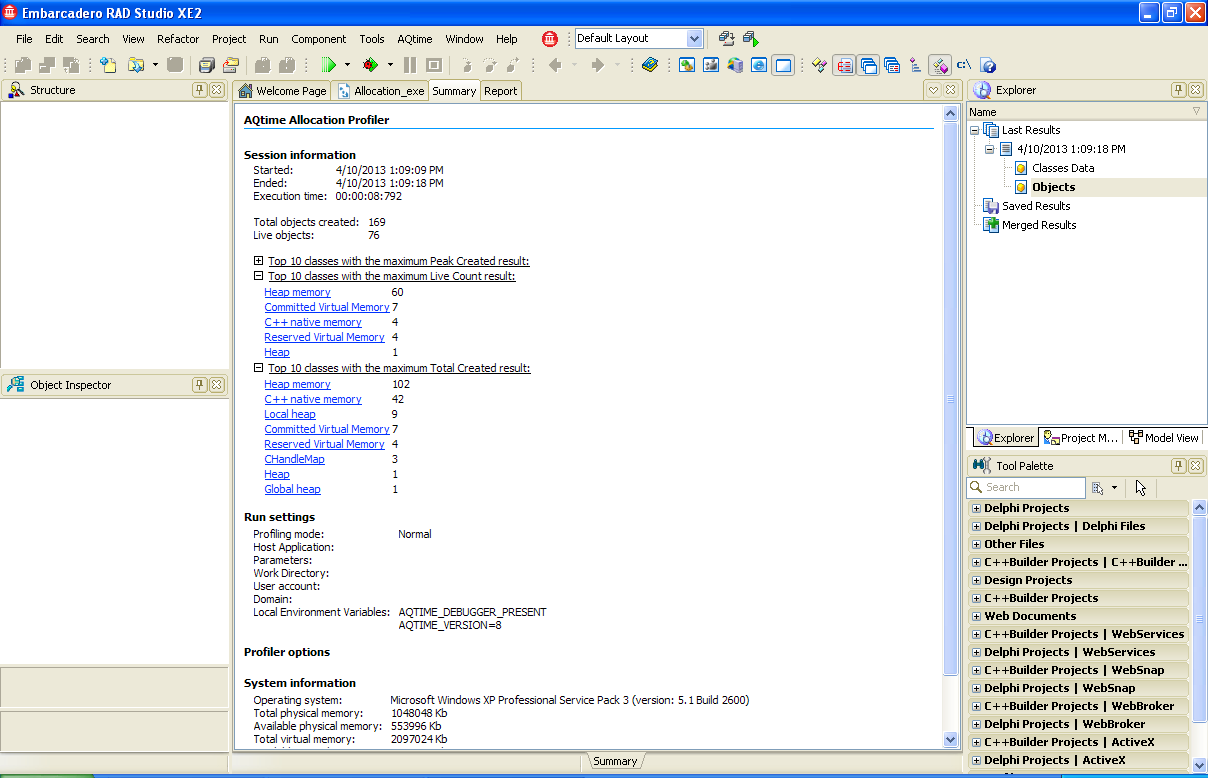
The Allocation profiler traces the use of classes that are added to class-level areas. Like other AQTime profilers, the Allocation profiler generates results upon selecting Run > Get Results from AQTime’s main menuselecting AQTime > Get Results from Visual Studio’s main menuselecting AQTime > Get Results from RAD Studio’s main menu, running the Get Results action, or after the application terminates. The following sections provide a brief overview of results and panels that hold them:
Viewing Summary Profiling Results
The Summary panel displays brief profiling results. It reports classes with the maximum number of existing instances, classes with the maximum number of created instances and so on:
Viewing Detailed Information
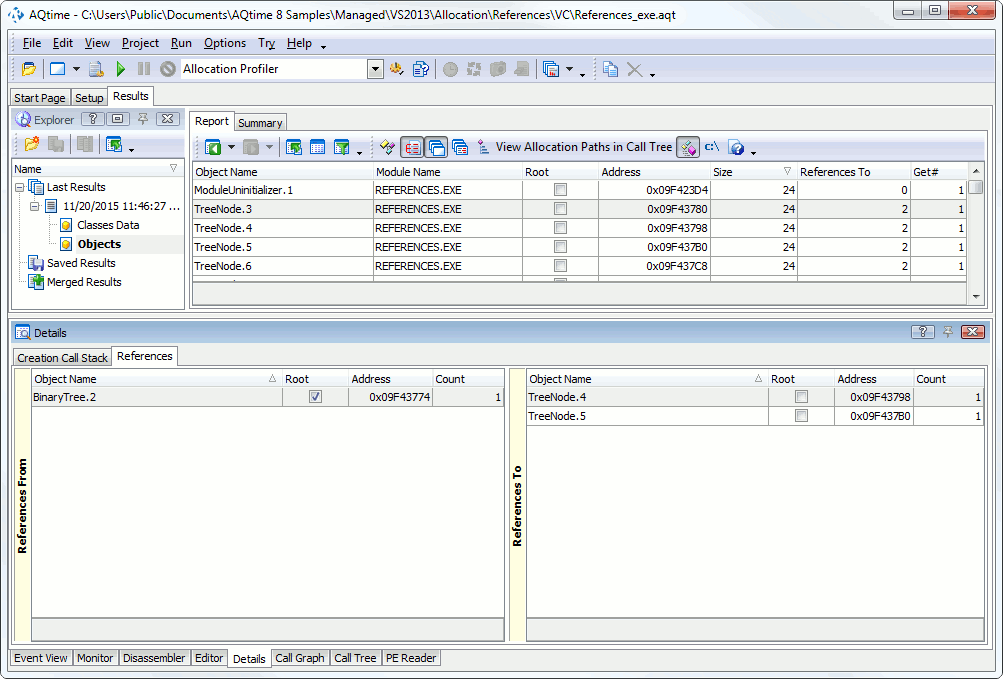
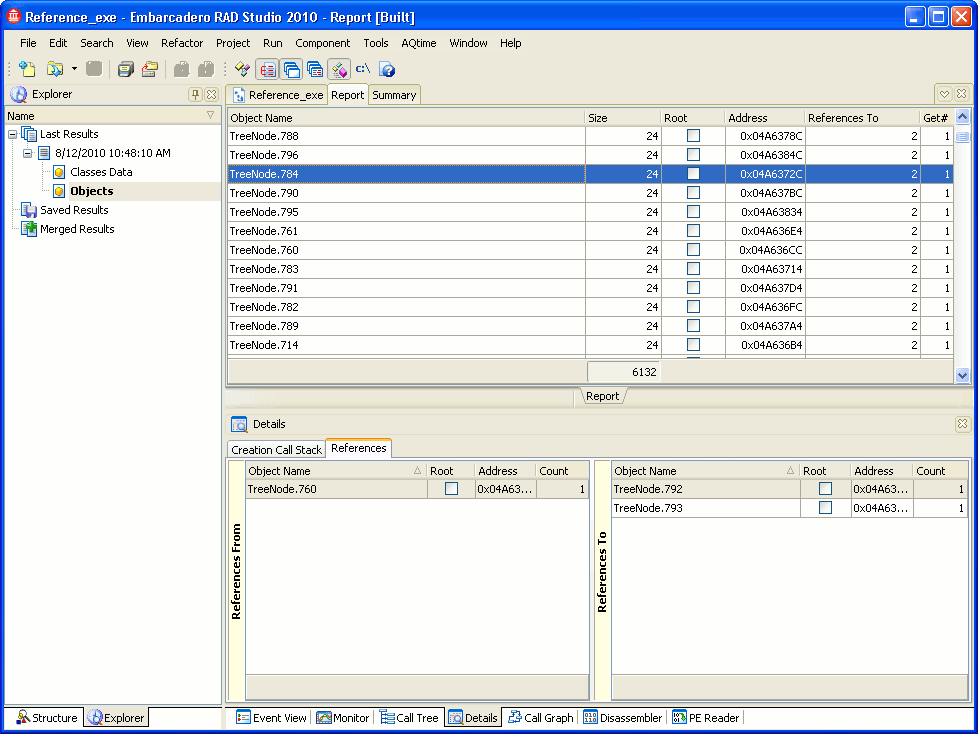
Information about all the classes and their instances that are used by the application is shown in the Report panel. Below is a sample output of the Allocation profiler:
As you can see, the profiling results are divided into two categories in the Explorer panel: Classes Data and Objects. The contents of the Report panel depend on which category is currently selected:
-
Classes Data
If the Classes Data category is selected, the Report panel displays information about classes whose instances were created during the run.
For a detailed description, see Allocation Profiler - Results of the Classes Data Category.
-
Objects
If the Objects category is selected, the Report panel displays information about objects and memory blocks that exist in the application at the moment the results are generated.
For a detailed description, see Allocation Profiler - Results of the Objects Category.
When you select an object or a memory block in the Report panel, you can view additional information (for example, the hierarchy of object references or a stack of function calls) in the Details, Call Graph and Call Tree panels. For a detailed description of the Allocation profiler panels, refer to the Allocation Profiler Panels Reference.
See Also
Report Panel
Details Panel
Call Graph Panel
Call Tree Panel
Allocation Profiler

 Viewing Summary Profiling Results