The Allocation profiler results are divided into two categories: Classes Data and Objects. When the Classes Data category is selected, the Report panel displays information about classes whose instances were created during the run.
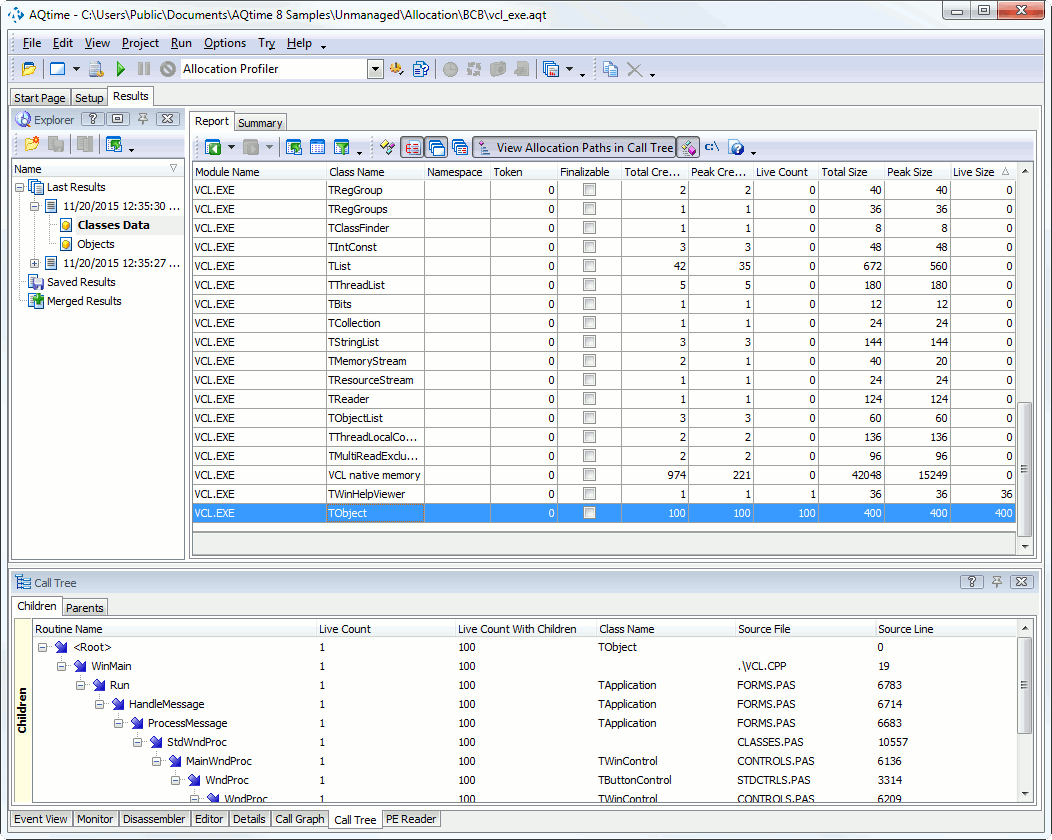
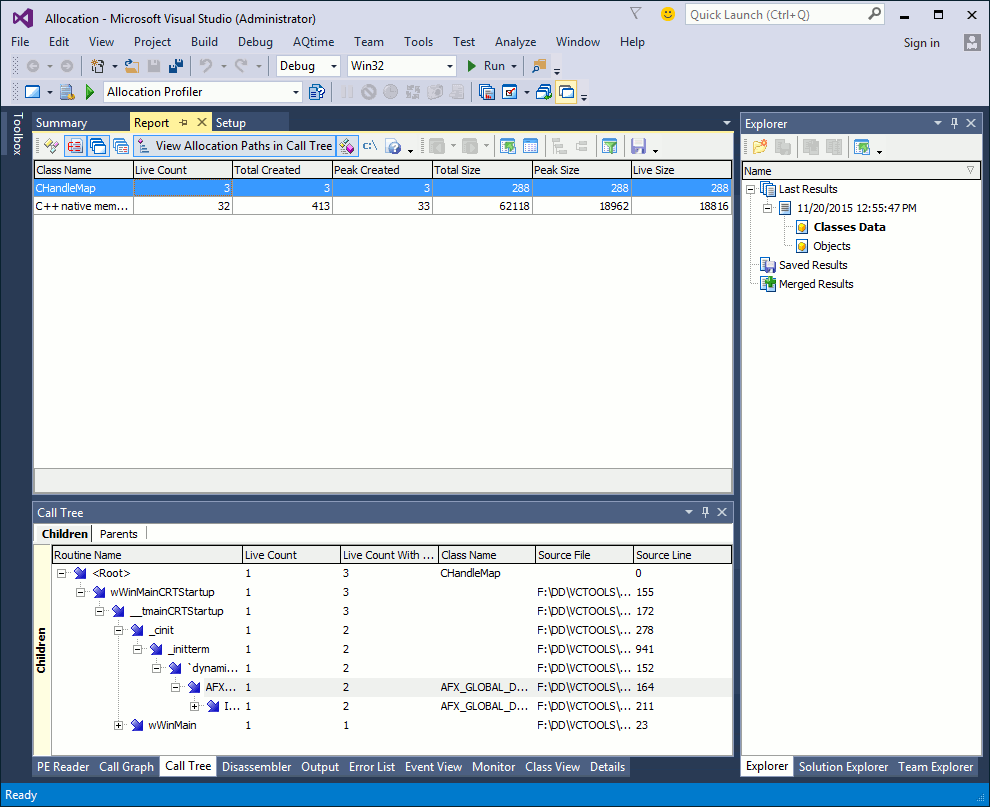
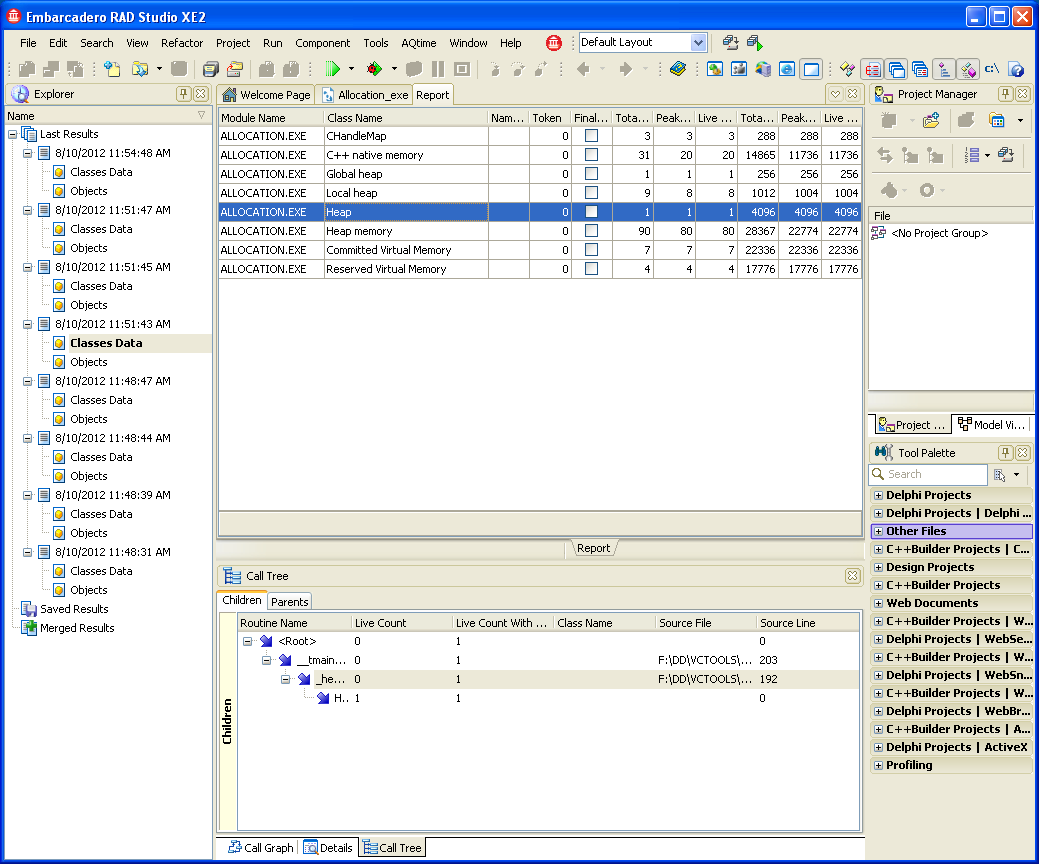
Here is a sample output of the Allocation profiler results displayed in the Classes Data category:
The following sections describe what information about classes you can obtain from profiling results:
 Specifics of Tracking Classes in Visual Basic, Intel C++ and Borland C++ Applications
 Specifics of Tracking Classes in Visual C++, Delphi and C++Builder Applications
Viewing Profiler Results
Each row in the Report panel shows profiling results for every single class: the total and current number of class instances, their size, etc. (The Report panel columns are described in the Allocation Profiler - Report Panel section.) This gives you a summary view on what happened in the application during profiling (you can also view the summary results in the Summary panel).
| Tip: | By default, the Report panel holds only some of the available columns. You can add more columns to the panel or remove columns from it. For more information on this, see Adding and Removing Columns. |
The Class Name column in the Report panel serves as the identifier of the class. The possible values are listed in the table below:
| Class Name | Corresponds To |
| EExternal IInvokable TForm, etc. |
The name of a class of an object instance. |
| C++ native memory VCL native memory VB native memory |
A memory block that is not an object instance (for example, a memory block allocated with the C++ malloc or Delphi GetMem function, or via the VB ReDim statement). |
| Memory Overwrite Error | Memory-write operation that has written data above the upper or below the lower bound of the allocated memory block. For more information on this, see Checking Bounds of Memory Blocks. |
| Committed Virtual Memory Reserved Virtual Memory Global heap Heap Heap memory Local heap |
Leaks produced by calls to Windows API memory management functions. See Tracing System Memory Management Functions. |
The footer of the Report panel column holds summary values for data displayed in that column. For instance, the footer of the Live Size column displays the summary size of all class instances that existed in memory at the moment of results generation. If you select two or more classes in the Report panel, the footer will show the summary values for the selected classes only (for more information on how to select several rows in a panel, see Selecting Several Records in a Panel).
To determine if class instances existed in memory at the moment of results generation, check the Live Count column value. If it is greater than 0, class instances existed. If you profile an unmanaged application and obtain results upon closing the application, non-zero values in the Live Count column help you find memory leaks. To find them quicker, you can sort or filter results in the Live Count column.
Specifics of Tracking Classes in Visual Basic, Intel C++ and Borland C++ Applications
AQTime does not report the names of classes in Visual Basic 6.0, Intel C++ and Borland C++ applications. These classes are traced as memory objects, and leaked classes (if any) are included in the following memory classes:
-
Visual Basic classes are included in the VB native memory class (see Analyzing Visual Basic Applications).
-
Intel C++ and Borland C++ classes are included in the C++ native memory class (see Analyzing Intel C++ and Borland C++ Applications).
Specifics of Tracking Classes in Visual C++, Delphi and C++Builder Applications
-
AQTime may or may not trace classes that reside in Visual C++, Delphi and C++Builder applications as memory blocks. In order for AQTime to be able to trace a class, as a class, not as a memory block, the class must meet certain requirements. For a detailed description of these requirements, see the Allocation Profiler - Analyzing C++Builder Applications and Allocation Profiler - Analyzing Delphi Applications topics.
-
When working with Visual C++ applications compiled in Debug configuration, the Allocation profiler tracks the actual size of memory blocks allocated by the profiled application. This size (the reported size) can be larger than the size specified in the application’s source code. See Allocation Profiler - Analyzing Visual C++ Applications for more information.
See Also
Allocation Profiler - Results of the Objects Category
Allocation Profiler - Analyzing C++Builder Applications
Allocation Profiler - Analyzing Delphi Applications
Allocation Profiler - Analyzing Visual Basic 6.0 Applications
Allocation Profiler - Analyzing Visual C++ Applications
Allocation Profiler - Analyzing Intel C++ and Borland C++ Applications
Allocation Profiler


