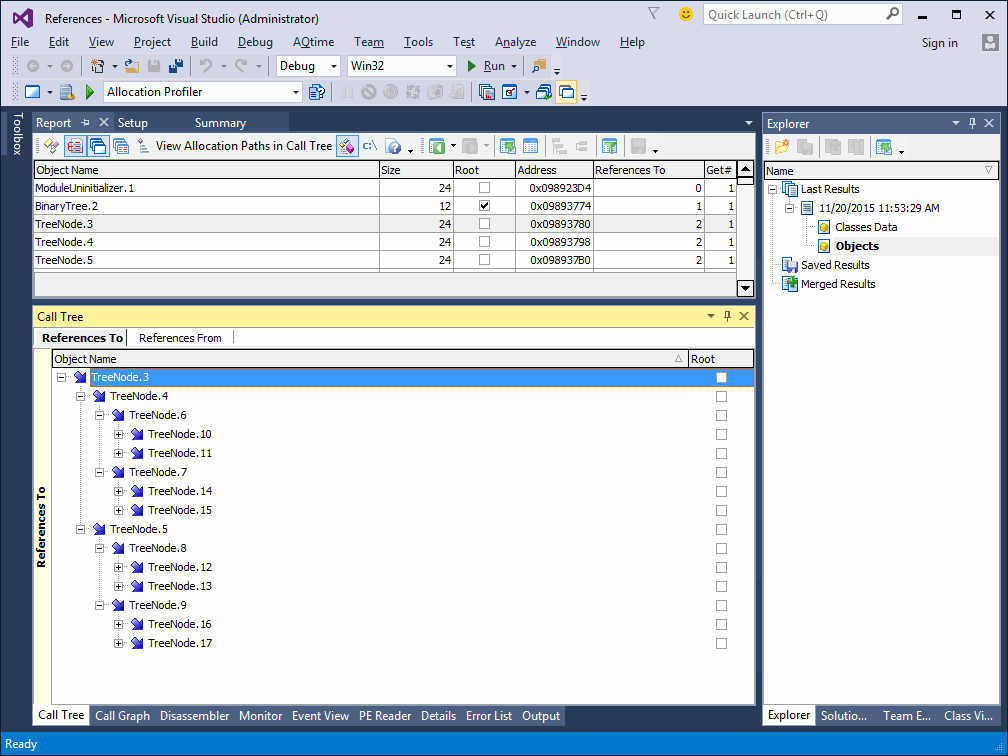
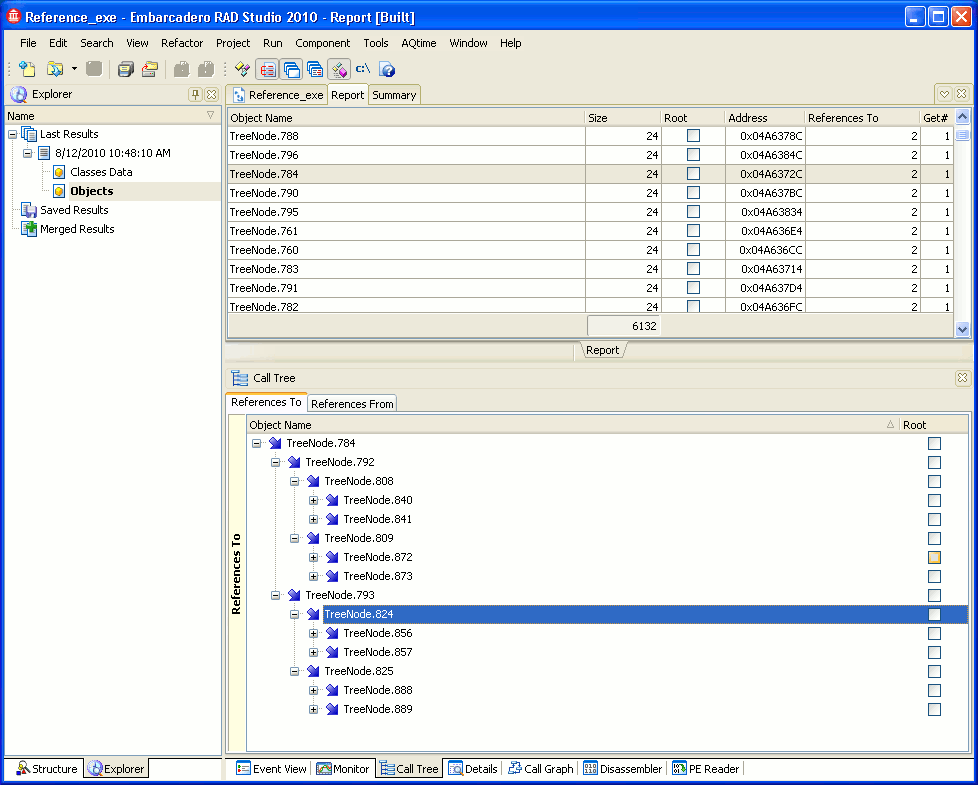
The Allocation profiler results are divided into two categories: Classes Data and Objects. When the Objects category is selected, the Report panel displays information about class instances (objects) and memory blocks that exist in the application at the moment the results are generated. If the Check Memory Bounds option is enabled, the panel can contain information about memory operations outside of the allocated memory block.
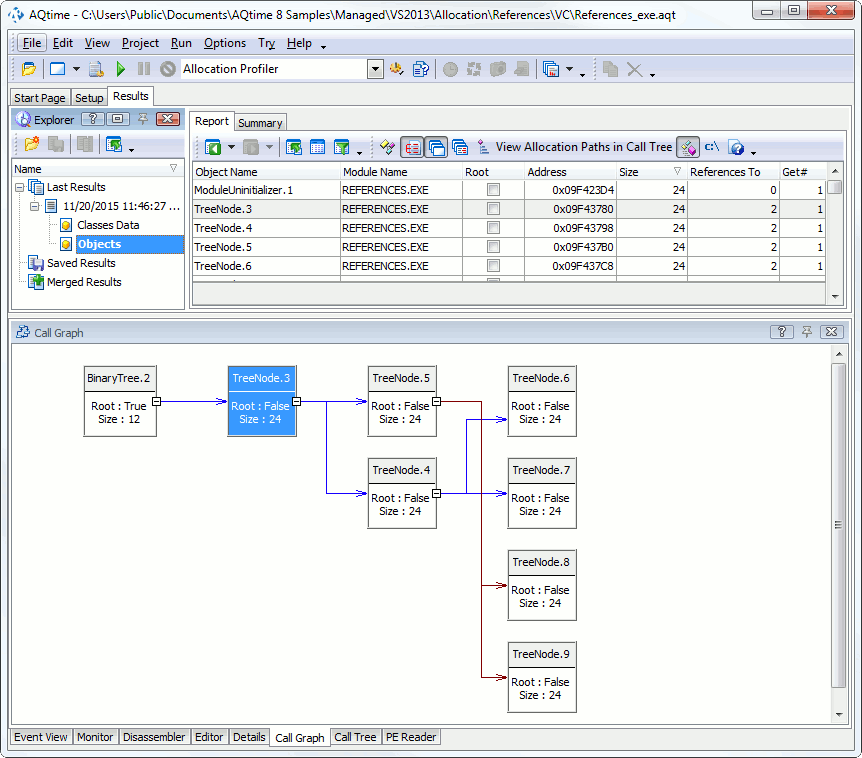
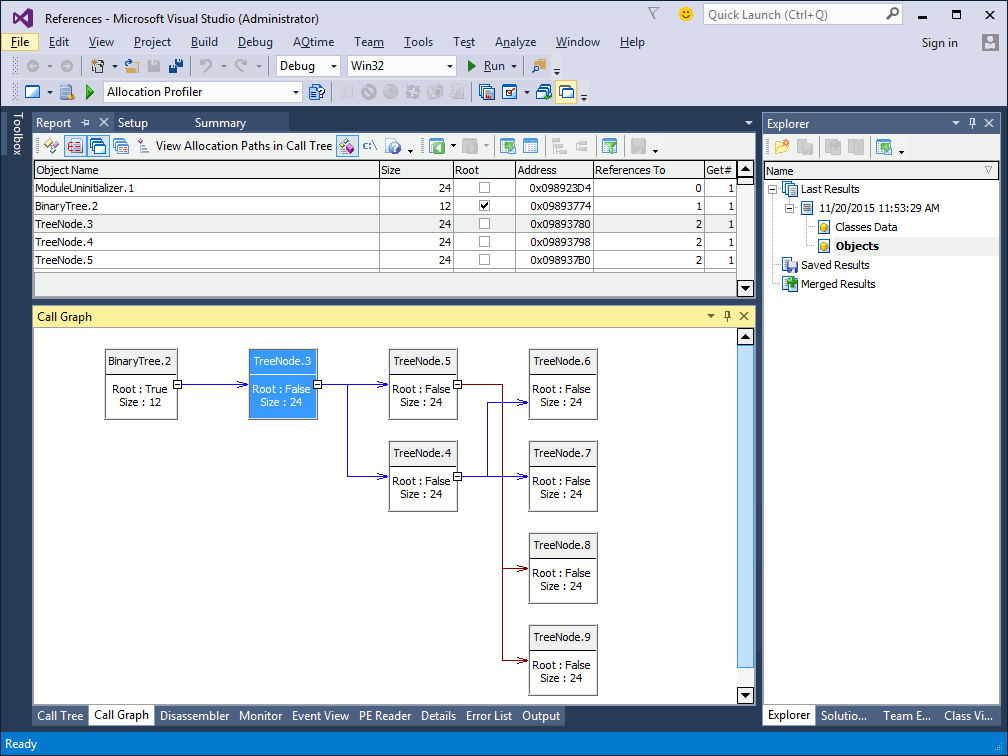
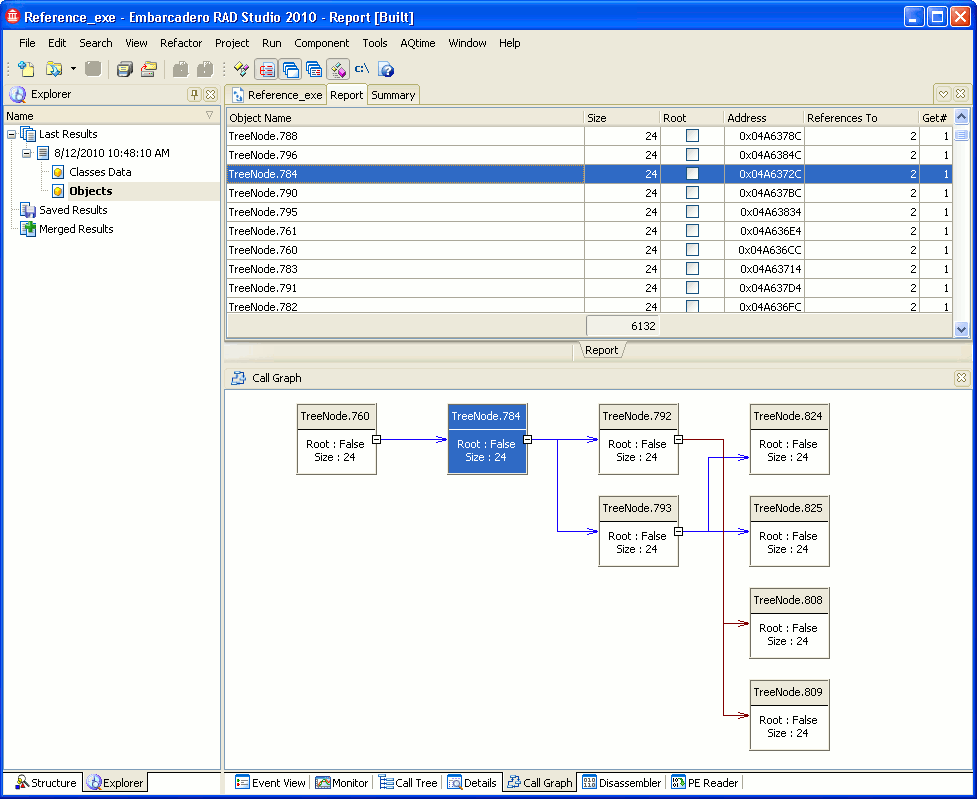
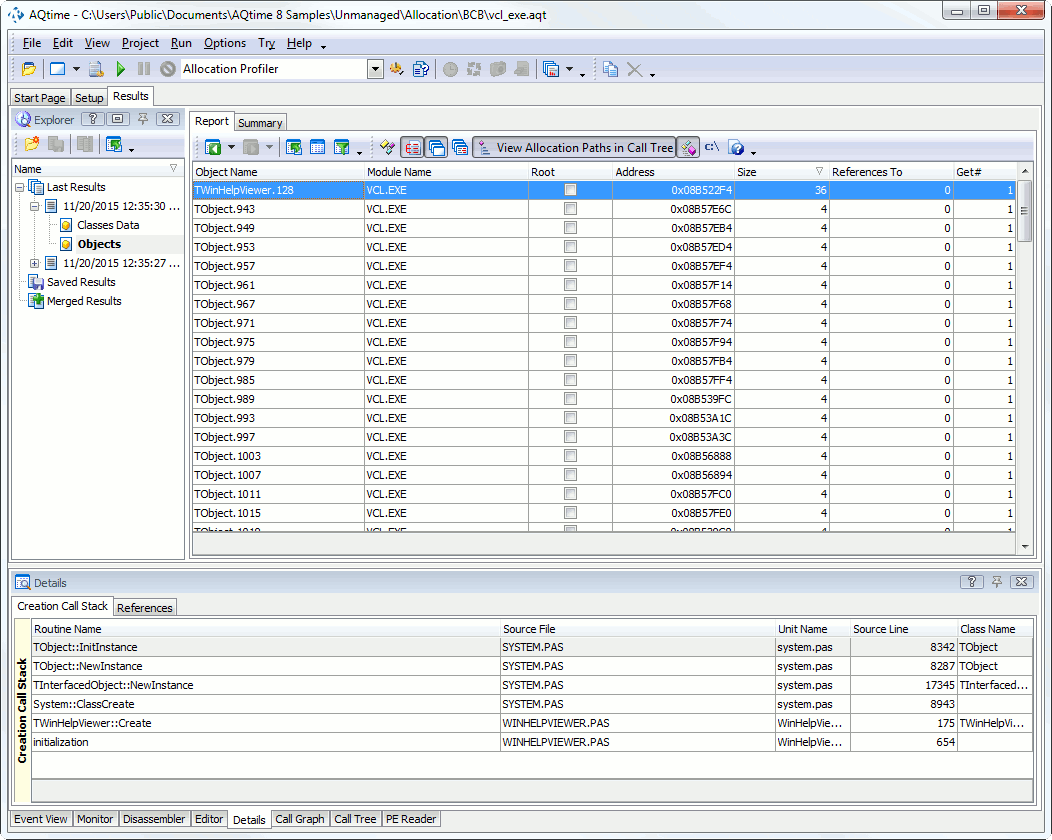
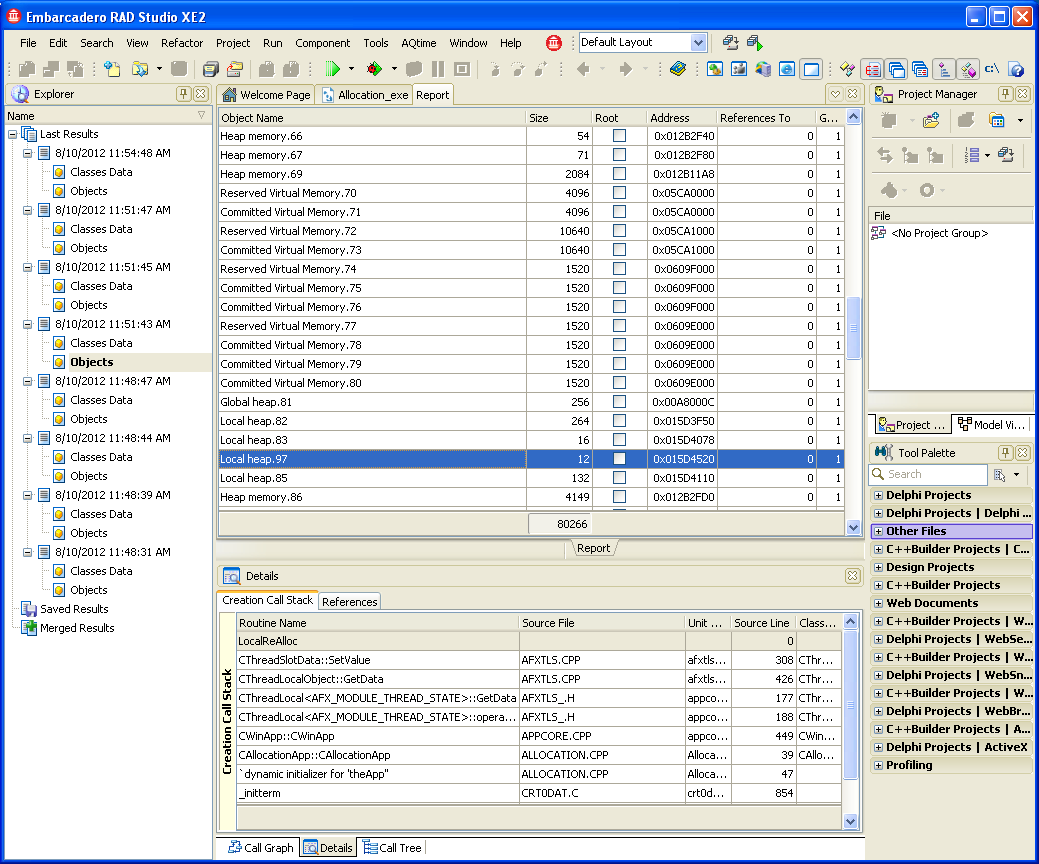
Here is a sample output of the Allocation profiler results displayed in the Objects category:
The Details, Call Graph and Call Tree panels display additional results for the object selected in the Report panel (see the sections below).
| Note: | The Allocation profiler traces and displays references to managed objects only. If you select an unmanaged object in the Report panel, the Call Graph and Call Tree panels and the References To and References From panes of the Details panel will display only the selected object, without any links to other objects. |
The following sections describe what information about objects and memory blocks you can obtain from profiling results:
Viewing Profiling Results
Every row in the Report panel holds results for a single object or memory block. The Object Name column serves as the identifier of the object or memory block. The following table lists the possible object names and describes what values correspond to them:
| Class Name | Corresponds To |
| Object_name.NN | Object identifier. For example, the name String.5 means the fifth String object created after profiling started. |
| C++ native memory.NN VCL native memory.NN VB native memory.NN |
The NNth memory block allocated with a C++ operator, VCL memory management routine or VB statement (such as new, GetMem and ReDim) |
| Memory Overwrite Error.NN | Data that was written to addresses above the upper or below the lower bound of the NNth allocated memory block. For more information, see Checking Bounds of Memory Blocks. |
| Committed Virtual Memory.NN Reserved Virtual Memory.NN Global heap.NN Heap.NN Heap memory.NN Local heap.NN |
Leaks produced by calls to Windows API memory management functions. For detailed information, see Tracing System Memory Management Functions |
To view all the objects of a certain class, filter the results on the Class Name column (See Filtering Results).
The Report panel columns are described in the Allocation Profiler - Report Panel section.
Viewing Several Sets of Results
If you pressed  Get Results during the Allocation profiler run, you get two result sets: one that was generated upon pressing that button and another that was generated upon closing the profiled application.
If you want to distinguish the sets of results, pay attention to the Get # column. It displays the ordinal number of the result set within a run. In the first result set, the Get # column will hold 1 in all the records; in the second result set, this column will hold 2. You can use these values for comparison purposes. For instance, when you compare two result sets, the column will clearly tell you what objects were created or deleted between the two moments of results generation.
Viewing Call Stacks in the Details Panel
The Details panel holds three tabbed pages: Creation Call Stack, References From and References To. You can arrange all three pages within the Details panel as you desire.
-
The contents of the Creation Call Stack page depend on the type of the row selected in the Report panel:
-
If the row corresponds to an object, then the page displays the stack of function calls that led to the object creation.
-
If the row corresponds to Memory Overwrite Error, then the call stack shows the sequence of function calls that led to the error detection.
Note: The Creation Call Stack page lets you view the stack of function calls that led to the creation of individual objects. However, if you have several existing instances of the same class, it is recommended that you analyze them together first. Probably, all of the unreleased instances are created by the same routine. In this case, you do not need to analyze each unreleased instance separately. For more information on how to track the creation of several class instances at once, see Allocation Profiler - Results of the Objects Category. -
-
The References To page contains a list of objects to which the object selected in the Report panel refers. The References From page lists objects that refer to the object selected in the Report panel.
For more information, see the description of the Details panel and the Viewing Call Stacks topic.
Viewing the Hierarchy of Object References
The Call Graph panel displays the hierarchy of object references for the object selected in the Report panel. You can travel up and down this hierarchy by clicking the desired object.
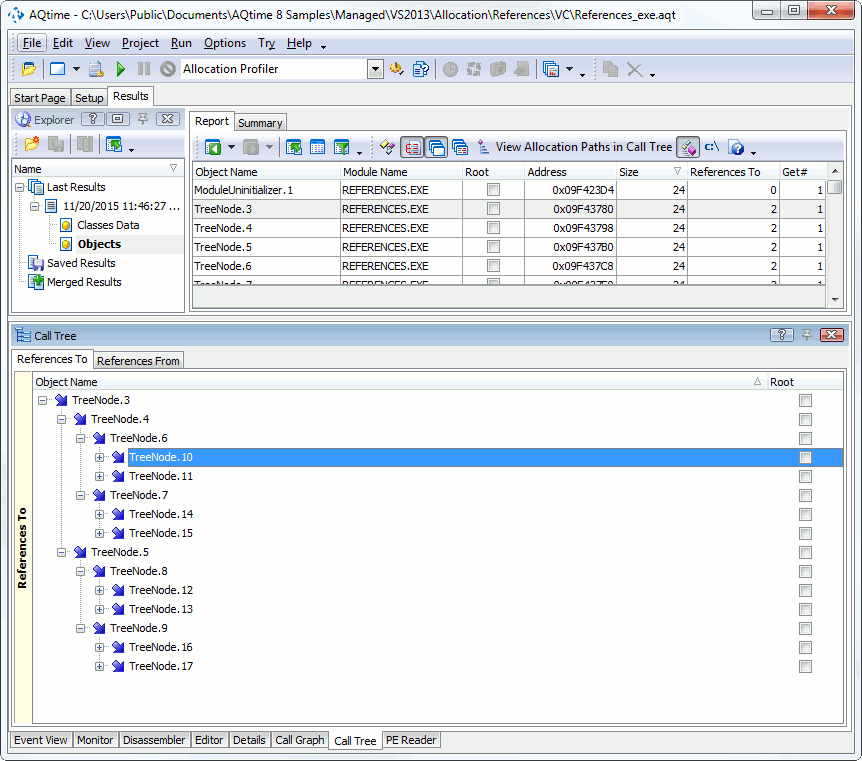
The Call Tree panel also displays the hierarchy of object references. This panel holds two pages: References To and References From. The columns on these pages are similar to the Report panel columns:
For more information, see the description of the Call Graph and Call Tree panels.
See Also
Allocation Profiler - Results of the Classes Data Category
Allocation Profiler - Call Tree Panel
Allocation Profiler - Details Panel
Allocation Profiler - Report Panel
Allocation Profiler


 Viewing Profiling Results