The Explorer panel allows you to manage profiling results.
The Name column of the panel displays profiling result sets as a tree-like structure. The column’s content depends on the Show results for all profilers option (see below). The Description column (it is hidden by default) displays the descriptions you add to result sets.
Current Profiler Results
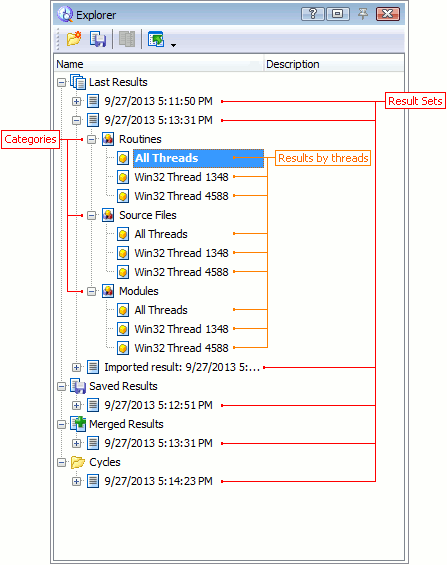
If the Show results for all profilers option is disabled (by default), the panel shows results only for the currently selected profiler. Below is a sample view of results in the Explorer panel:

There are a number of top-level nodes in the result tree:
-
Last Results - The results of all profiler runs are automatically stored under this node.
-
Saved Results - The results you save for future use are stored under this node.
-
Merged Results - Merged result sets are stored under this node. See Merging Results.
-
You can also add custom Folders to the result tree.
Child nodes of these top-level nodes are individual result sets. Their default names are specified according to the date and time when the results were generated.
Depending on the current profiler, each result set node can include one or more category nodes. Categories specify the type of data the profiler collects. For example, the Allocation profiler’s results have the Classes Data and Objects categories and the Performance profiler’s results have the Routines, Source Files and Modules categories. To learn which categories the results of a profiler can have, see the profiler’s description.
Some profilers divide the results collected for multi-thread applications into threads and store them as child items of the selected category node. The All Thread node contains the results collected across all threads. For more information, see Profiling Multiple Threads.
To see the result set data, double-click on the desired category or thread. Then you can view the results in the Report panel.
All Profiler Results
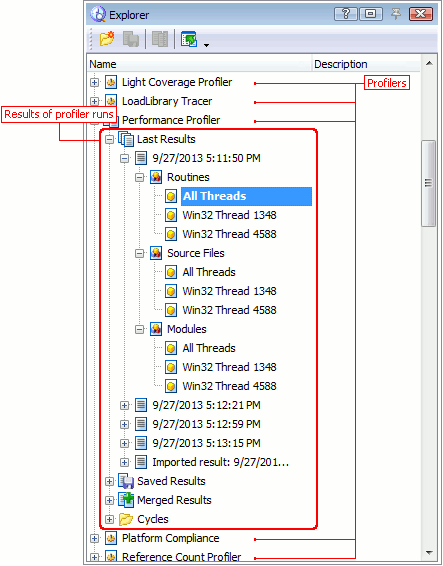
If the Show results for all profilers option is enabled, the Explorer panel displays a tree-like structure of results for all the available profilers. Below is a sample view of results in the Explorer panel:

The top-level nodes of the tree correspond to different profilers. Their child nodes are similar to the result tree described above.
See Also
Explorer Panel
About the Explorer Panel
Explorer Panel Settings
Working With the Explorer Panel

 Current Profiler Results